

5 Investing Strategies to Save Money and Grow Wealth
04/11/2024
“Investment planning is about structuring exposure to risk factors.” – Eugene Fama Jr.
The stock market had a profitable month in June, defying the adage to sell and go away in May. Many sectors were stronger than the S&P 500 (SPY) which is no longer a leader of the market but still making highs nonetheless.The S&P 500 SPDR (SPY) has consistently moved higher this year, a fine place to invest while being less volatile than other sectors.
You can see from the Table 1 that investors were selective. in what sectors There was a wide range of performance last month from +5.51% for energy to -0.24%) for consumer staples. Utilities and Finance were the also strong and Industrials was another laggard.
Table 1
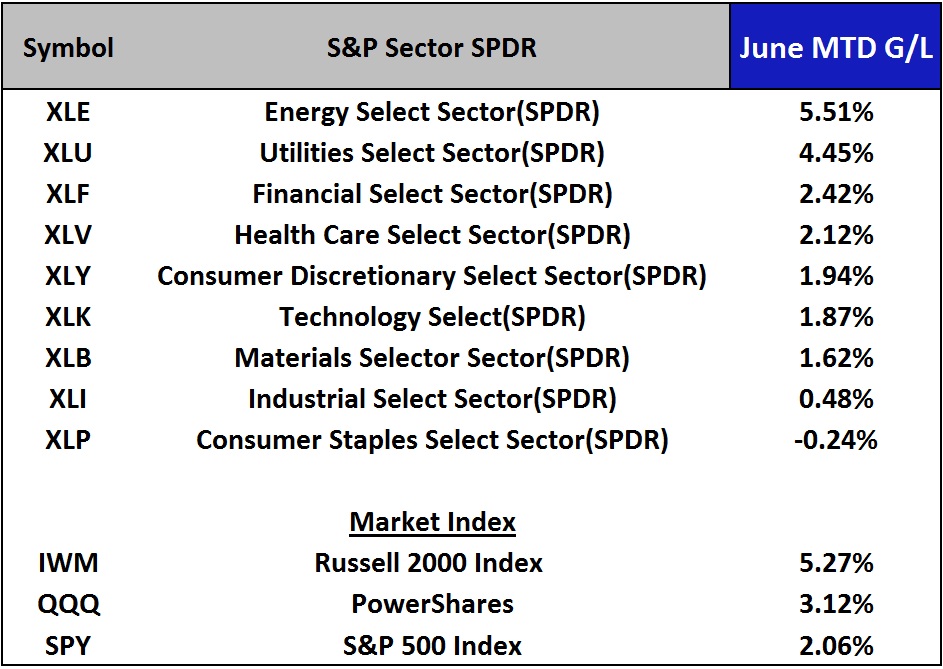
The iShares Russell 2000 Index ETF (IWM) small cap was a leading market index, gaining over 5% as the market rally broadened in scope. On July 1, IWM hit my objective of 120 (mentioned in the 06/20/14 newsletter), slightly surpassing the 3/04/14 high. After making the high, a slight retracement back to the breakout level occurred, including a price drop due to a $0.45 dividend.
What is the S&P 500 SPDR (SPY) Monthly Chart Saying Now?
Since we are at the beginning of a new month, I thought it would be good to review where we are on the monthly S&P 500 (SPY), chart which is trading at it top channel 197.00, (like small caps), and which are also at a very key resistance area (not shown).
One of my favorite tools for chart analysis is the Andrew’s Pitchfork developed by Alan Andrews. I use Andrews’ Pitchfork for identifying major channels that I think have significance. Many charting software packages give you this option to draw easily and they can be used on all time periods when trading. To be able to use this technique you need three points, each marking an important pivot point which I have identified above.
You will see in the monthly SPY chart (right) that price is rising in an uptrend with a major low-high-low point configuration that I have connected. Notice how we are at the upper channel line, a very critical point. This is a major resistance line where the S&P 500 is now. If SPY can make further highs by penetrating the 197 area, this would be a bullish development and I would expect higher prices moving into the summer months. Higher projections from using the Andrew pitchfork analysis would be 220 followed by 245 while support is 170 followed by 145.
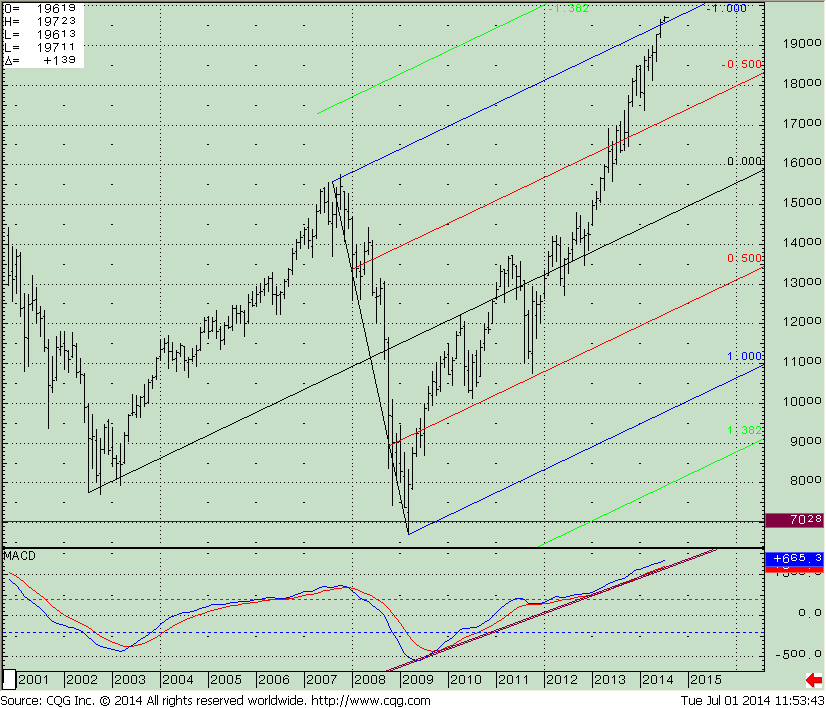
The lower portion of the chart is MACD, a momentum indicator which is at its highest reading confirming the price high. Also notice the uptrend in place with no violations taking place from the March 2009 low.
S&P 500 SPDR (SPY) Daily Chart
There are two key uptrend lines that are significant on the S&P 500 daily chart (below). The first trend line connecting the lows from April 2014 is steep with support at 193.00. The second trend line has more significance with support at 189.00. This line would likely attract traders to do some more selling of their investments. A break below would give a downside objective to 178. As long as both of these uptrends remain intact, I expect price to continue to achieve another milestone and trade over 200.00.
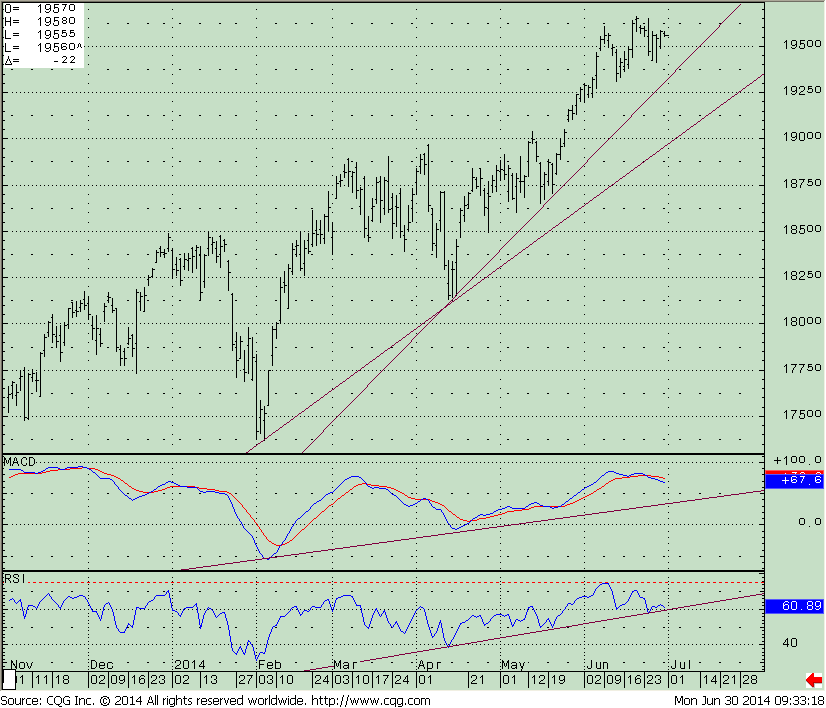 Prices continued higher and no major sell off has occurred. Once again there are negative divergences in MACD and RSI(14) that need to be watched. As price has moved higher during the uptrend, there have been negative divergences where price makes a high and momentum doesn’t confirm. The bearishness of these negative divergences is mitigated by the fact that there has been no breaks in the
momentum uptrend lines for either MACD or RSI in the daily chart.
Watch for the daily chart to give a clue of further diminishing momentum, which could be a sign when the next selloff takes place. This could be potentially of more significance than what we have had so far this year. I continue to give the market the benefit of the doubt.
Just To Sum Up
The stock market continued to rise in June reaching upper channel objectives on the S&P 500 (SPY) and the Russell 2000 (IWM). Momentum is weakening which could be a potential problem later on. But for now, the uptrend remains intact with the bulls in full control. The market tape action is positive. The numbers of stocks making new lows are very small, market breadth is moderately favorable, and more aggressive sectors have joined the rally. I continue to give the market the benefit of the doubt and I’m expecting the market to break through resistance giving new higher upside channel objectives.
I invite you to share your comments by Emailing bgortler@signalert.com or call Bonnie at 844-829-6444.


Create more wealth in your life
with these simple strategies.
As an added bonus you will also
receive BG’s Updates and Ezine

Discover how to quickly create more well-being in your life with these simple strategies.
As an added bonus you will also
receive BG’s Updates and Ezine

As an added bonus you will receive BG’s Updates and Ezine

All work listed on BonnieGortler.com is licensed under a Creative Commons Attribution - Noncommercial - No Derivative Works 3.0 Unported License.
