

5 Investing Strategies to Save Money and Grow Wealth
04/11/2024
“Inaction creates nothing. Action creates success.” ― Stephen Richards
Stock market performance for the month of April was split. Energy and utilities were leaders while the S&P 500 was slightly profi table but unable to make new highs. The healthcare, consumer discretionary and fi nance sectors lagged the S&P 500 (SPY), which has been unable to get through overhead resistance near 190.00. This wide spread of gains and losses for the month of April is a mixed message for the market going forward. Some sectors continue to climb but the rally is selective, not broad in scope, with warning signs persisting. Small caps continue to lag the S&P 500 in terms of relative strength, suggesting caution going forward. When small caps lead, the overall market tends to go higher and most times there is less risk. As we move further into May this will no longer be the case because, favorable seasonality has ended. With both these factors taking place along with momentum weakening, the odds are increasing for a correction to take place sooner rather than later.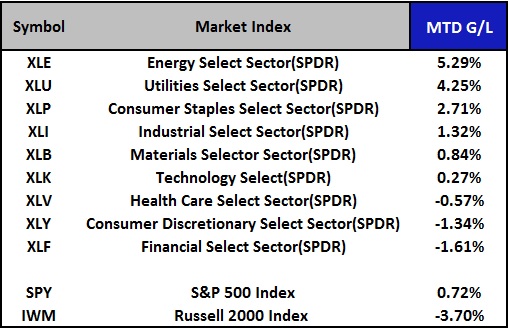
You can see from the table to the right that traders moved into defensive areas in April for safety with utilities and consumer staples having a very strong month. The energy sector was a surprise leader. Our model has been suggesting that the odds were favorable and that risk would be contained. Now these areas are extended on a short term basis, so once again traders might rotate out of these sectors looking for value elsewhere, or pause to digest their recent gains. The technology sector was an area that was under performing. Even with Apple’s (APPL) recent strong gains (hitting a new yearly high) after their earnings announcement, notice how the sector as a whole was not a leader for the month. Notice the S&P 500 had only a small gain and the Russell 2000 (IWM) is lagging badly.
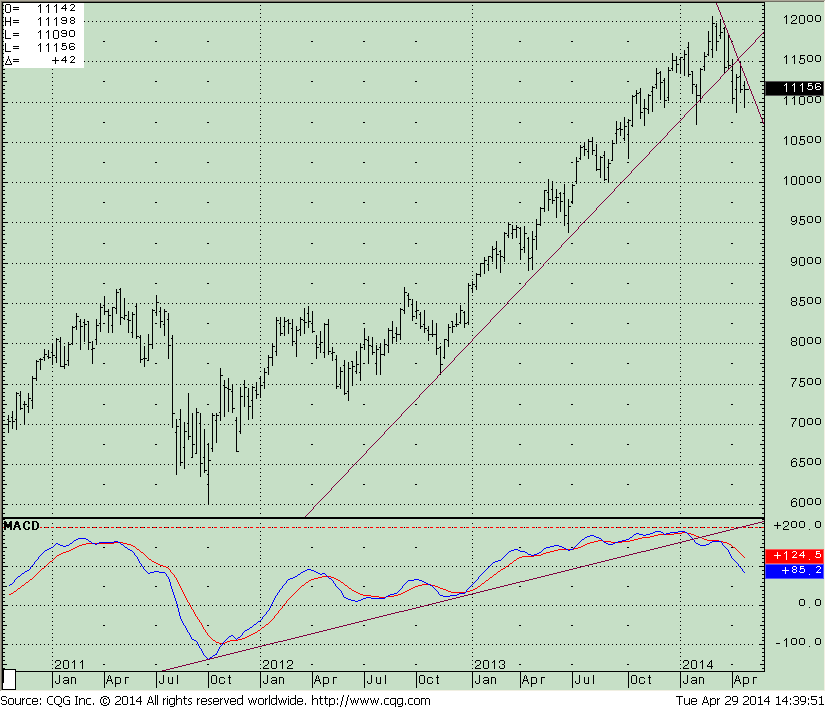
What is the Weekly Russell 2000 (IWM) Chart (right) Saying Now?
The Russell 2000 (IWM) intermediate trend is down. Price is below the uptrend from October 2012. The damage to the index was done earlier in the month. Prices have stabilized but there have been no gains in the last two weeks since the last newsletter on April 17, 2014, when IWM was trading at 111.09. In this chart IWM is trading at 111.56. However, as of this writing IWM is at 110.76, showing no strength, which is not a good sign for the market going forward. Caution is necessary until we break the recent short term downtrend of 112.50. Resistance lies above at 117. 50. I would be more bullish and more optimistic about the market moving higher if prices were strong enough to get through this line where prices broke down from. The next key support is 107.00 which is just below daily support (see chart below). A break below 107 would be unfavorable with downside projections of 97.50, followed by 87.50, a retracement to levels not seen since 2012.Momentum as measured by MACD on the lower portion of the weekly chart continues to weaken evenwith the sideways action that we have had recently. The lack of turn-up in MACD so far needs to be monitored.
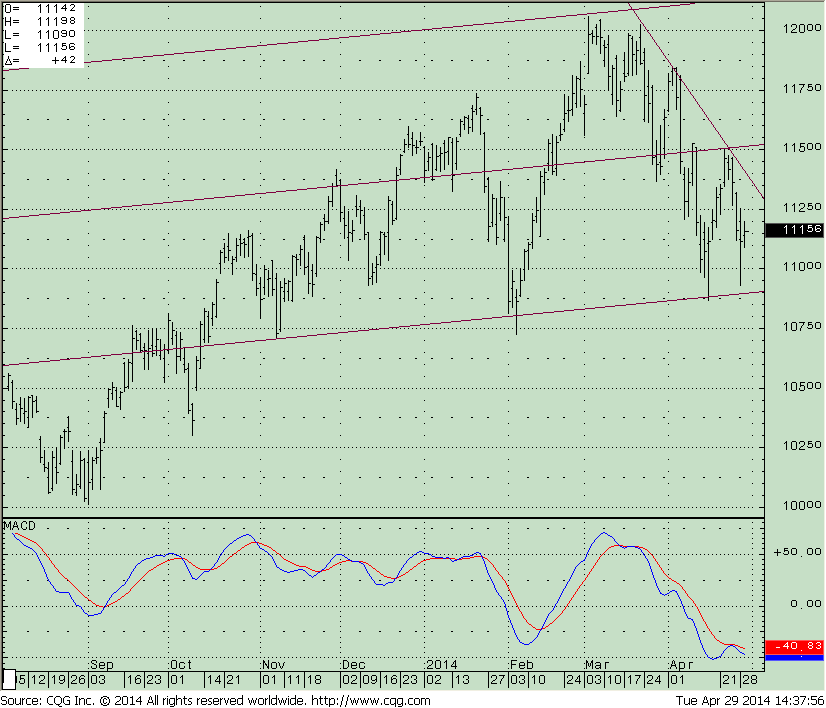
What is the Daily Russell 2000 (IWM) Chart Saying Now?
I have drawn in the daily operative trading channel, the high of 120.50 and a low of 107.27, which I think is very significant. The Russell 2000 (IWM) has lower highs and has not been able to break the short term down trend. MACD on the lower portion of the chart is in an oversold area from where good buying opportunities can develop. The longer it takes for the IWM to break the short term trend, the less likely the channel break will be to the upside. The lower end of the channel, 109.00 is just above the old lows. If they do penetrate those lows, it would correspond to the breakdown below $107 discussed above as a bearish warning sign implied in the weekly chart.
In Sum Small caps in the month of April are much weaker than the S&P 500, trading near the lower trading ranges and support, not a good sign. Favorable seasonality is no longer supporting the market. The S&P 500 has been unable to make a new high, and small caps are closer to their recent lows of the trading range rather than near the top of the range near new highs. So far, each time the market has pulled back buyers step right back into the market, thinking a buying opportunity exists. But with seasonality no longer favorable, the advance is getting more and more selective with defensive sectors leading the way higher. This is not a sign of a healthy market. Small-caps are out of favor and some technical damage has occurred.
I continue to believe it’s a good time to reduce your risk by having an exit strategy in place for your equity position. If the IWM falls below 107 this could be the message that a bigger decline for the overall stock market will develop and that you should raise some cash while you wait for a safer buying opportunity.
What are your thoughts about the Russell 2000 (IWM) index? Do you think the key support area will hold and a decline of more magnitude will develop?
I invite you to share your insights or comments by Emailing bgortler@signalert.com or call Bonnie at 800-829-6229.
GET A FULL YEAR OF THE SYSTEMS & FORECASTS NEWSLETTER
for a SPECIAL DISCOUNT – $99
This is a hypothetical result and is not meant to represent the actual performance of any particular investment. Future results cannot be guaranteed.
Although the information is made with a sincere effort for accuracy, it is not guaranteed either in any form that the above information is a statement of fact, of opinion, or the result of following any of the recommendations made herein. Readers are encouraged to meet with their own advisors to consider the suitability of investments discussed above for their own particular situations and for determination of their own risk levels.


Create more wealth in your life
with these simple strategies.
As an added bonus you will also
receive BG’s Updates and Ezine

Discover how to quickly create more well-being in your life with these simple strategies.
As an added bonus you will also
receive BG’s Updates and Ezine

As an added bonus you will receive BG’s Updates and Ezine

All work listed on BonnieGortler.com is licensed under a Creative Commons Attribution - Noncommercial - No Derivative Works 3.0 Unported License.
