

5 Investing Strategies to Save Money and Grow Wealth
04/11/2024
“Successful Investing takes time, discipline and patience” ~Warren Buffett
Stock market volatility continues in 2015 with wide intraday swings up and down, but the market has firmed after the S&P tested its December lows and held. Volatility is no surprise in the month of January and I expect there will be larger daily percentage moves as the year progresses compared to the low volatility that there was in 2014. Twice this month the market was down five straight days but then rebounded. The US market was stronger than most international markets in 2014 but it appears that some overseas markets could now be ready to join the advance, and could be stronger than the S&P 500 index (SPY). The international area has been out of favor but with recent firming action, I believe there is a very good buying opportunity that exists in the European markets.
What Are The Charts Saying Now?
Weekly iShares S&P Europe 350 Index ETF (IEV) (top) and RSI (Middle) and MACD (Bottom)
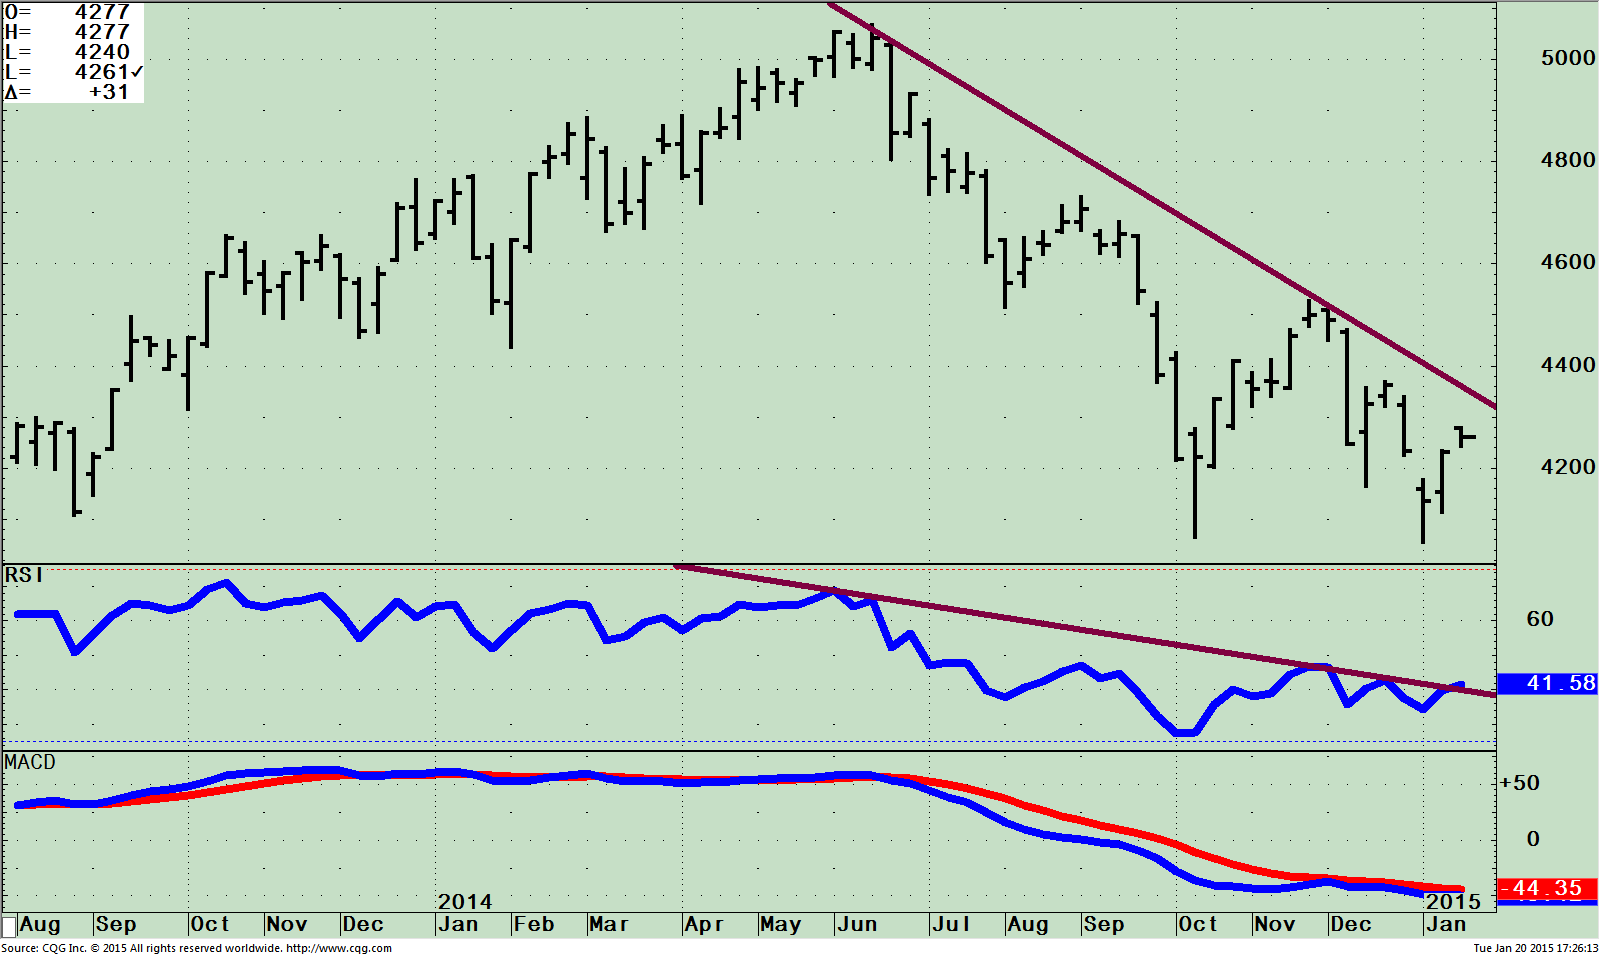 The top portion of the chart shows the weekly iShares S&P Europe 350 Index ETF (IEV), an exchange traded fund that gives you a convenient way to have broad exposure to European companies. The top five country holdings as of 01/26/2015 are United Kingdom 31.92% Switzerland 14.95% France 14.68%, Germany 13.47% and Spain 5.07%. IEV peaked at 50.71 on June 19, 2014, fell to a low on October 16, 2014 at 40.63 and now appears to have successfully tested its lows and is ready for an advance. There is a clean break in the down trend both in price and in momentum on the daily chart (not shown). Although the price down trend from June has not yet been broken on the weekly chart, my expectation is this will happen soon. Momentum oscillators are in favorable position for an intermediate term rally to develop. A break above 43.50 will break the weekly downtrend and give a price objective to 49.50, a potential 15% gain.
RSI, (middle chart) a momentum indicator went below 30, had a positive divergence where price made a low but RSI made a higher low. I also view it as bullish that since the sharp decline, there was a successful test of the lows forming a bottom that is spread over 12 weeks.
MACD, (bottom chart) a momentum indicator is oversold, below 0, a potentially bullish condition from where strong rallies can develop. At this time a turn up hasn’t taken place, but if prices continue higher, MACD will also confirm RSI.
Weekly Relative Strength Ratio Between IEV and SPY (top), RSI of this ratio (middle), and MACD of this ratio (bottom).
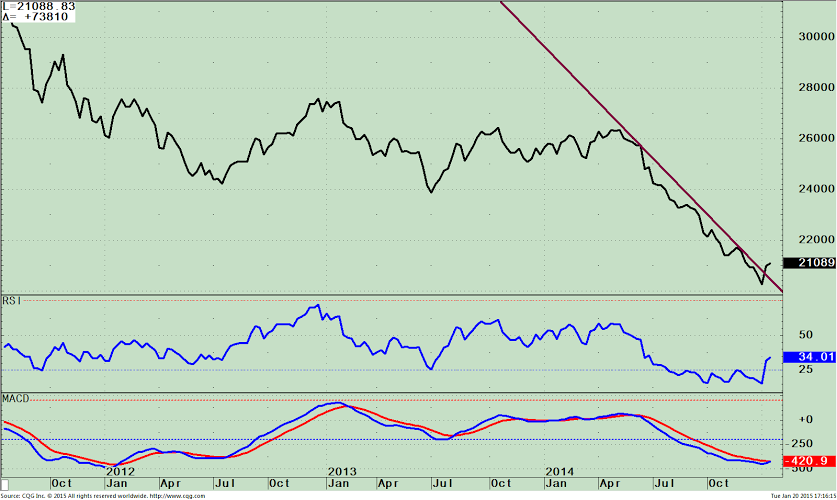 The relative strength ratio (top chart) between two indices is one of my favorite ways to identify when a potential change in leadership could happen early on in the move. These charts all have favorable patterns indicating superior performance by European equities should lie ahead.
Notice in the top chart the solid break in the downtrend that has occurred. This is showing a clear change in trend where the IEV is stronger than the S&P 500, (line is rising) now leading in relative strength. I prefer to use the weekly chart as a time frame over a daily chart to avoid being whipsawed with false breakouts. The monthly chart is also useful, but in certain moves it could be a bit slow and therefore better to use as a confirming indicator.
RSI (middle) penetrated the 30 level and has its highest reading since June of 2014 breaking out from its recent consolidation giving a buy signal.
MACD (bottom) is oversold, the most since 2012 and has now made a turn up from being very oversold, bullish, and also given a buy signal for IEV.
Just To Sum Up:
Market volatility is expected to continue. The S&P 500 has so far held its December lows and now it appears Europe has also tested its lows successfully. Technical momentum indicators of the European sector have started to break downtrends. This development could potentially be the fuel to lead the US stock market higher.
I invite you to share your stock market insights by calling me at 1-844-829-6229 or Email me at bgortler@signalert.com with your questions or comments.


Create more wealth in your life
with these simple strategies.
As an added bonus you will also
receive BG’s Updates and Ezine

Discover how to quickly create more well-being in your life with these simple strategies.
As an added bonus you will also
receive BG’s Updates and Ezine

As an added bonus you will receive BG’s Updates and Ezine

All work listed on BonnieGortler.com is licensed under a Creative Commons Attribution - Noncommercial - No Derivative Works 3.0 Unported License.
