
Bonnie’s Market Update 9/6/24
09/07/2024
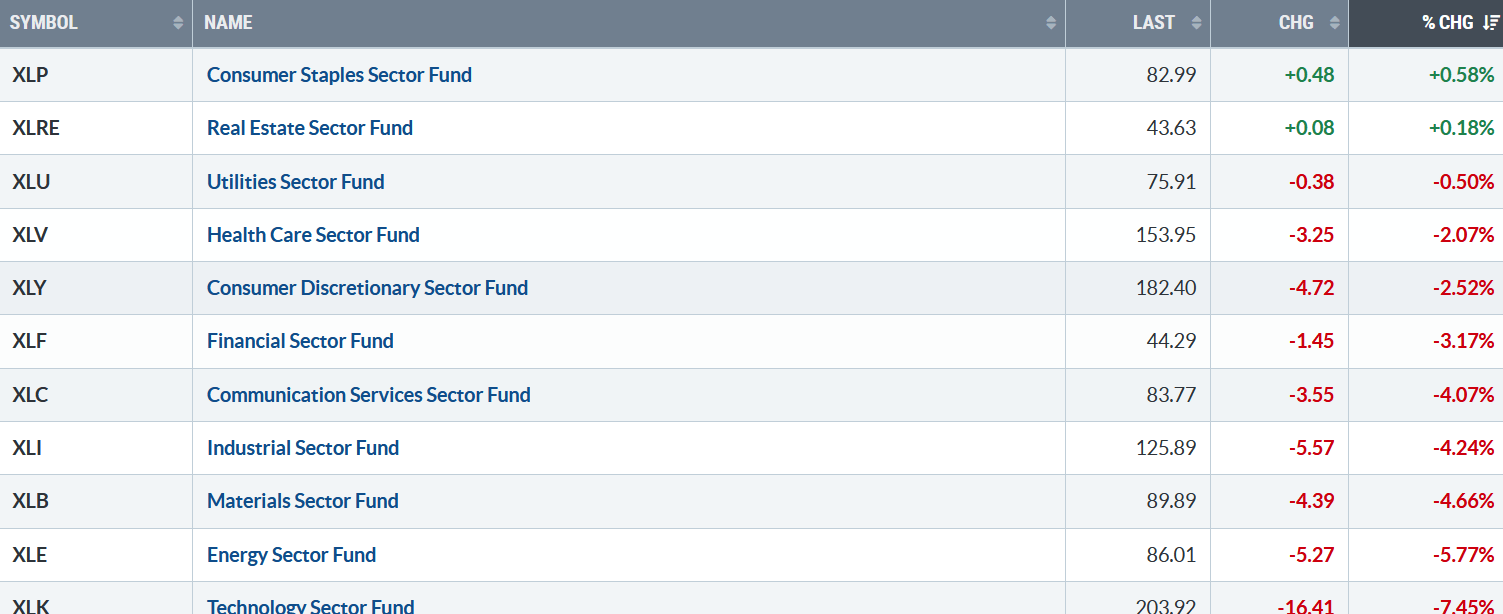
September, a weak month seasonally, started lower. Nine out of the eleven S&P SPDR sectors finished lower last week. Consumer Staples (XLP) and Real Estate (XLRE) were the strongest, while Energy (XLE) and Technology were the weakest. The SPDR S&P 500 ETF Trust (SPY) fell -4.14%.
S&P SPDR Sector ETFs Performance Summary 8/30/24-9/6/24
090624 SPDR Sectors
Source: Stockcharts.com
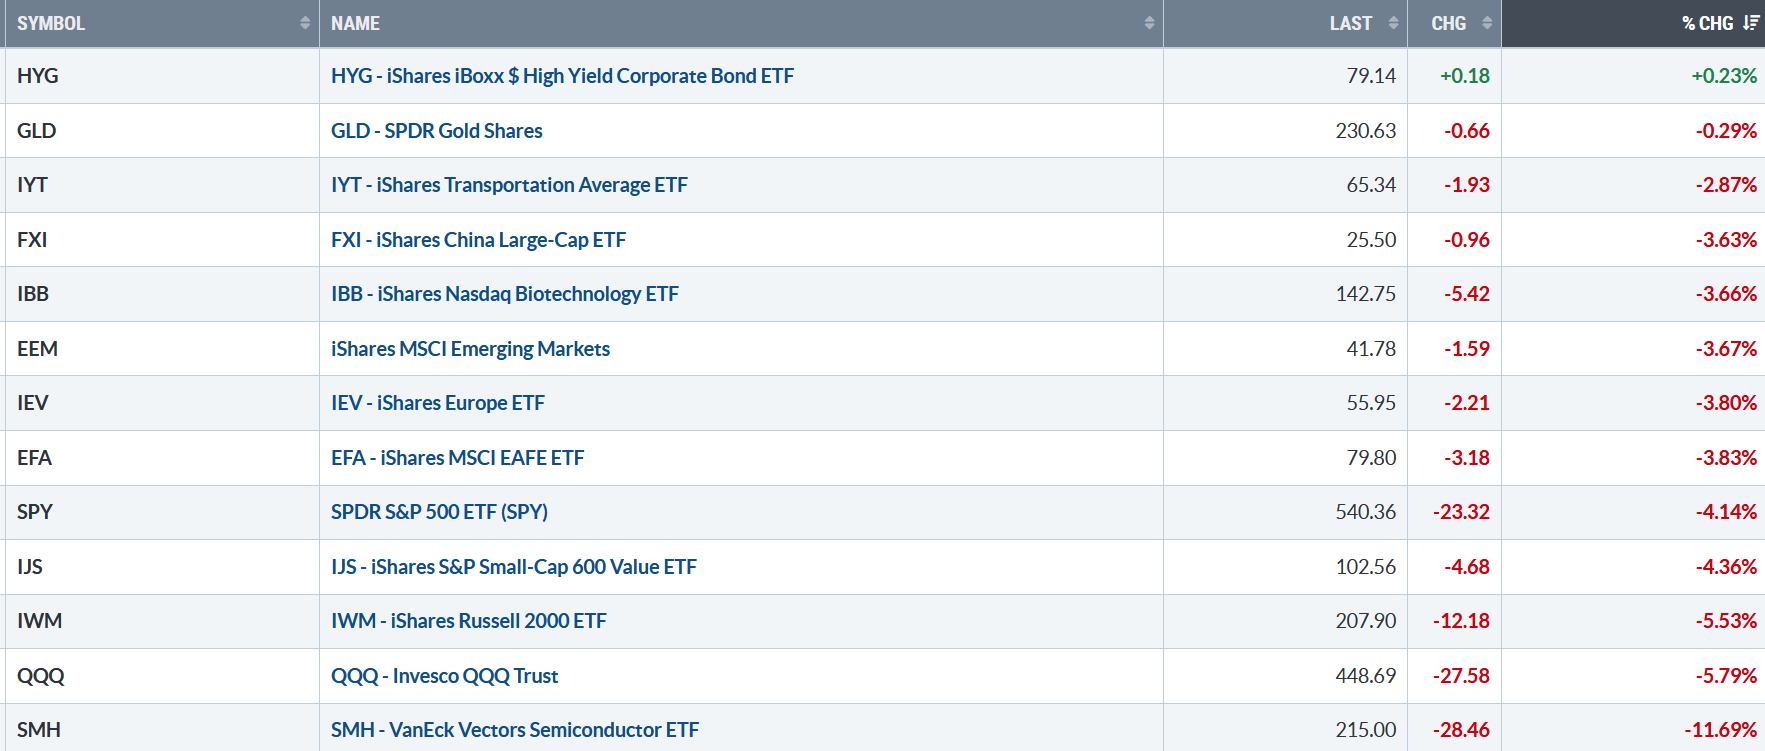
Figure 2: Bonnie’s ETFs Watch List Performance Summary 8/30/24-9/6/24
090624 Bonnie’s ETF Watch List Performance
Source: Stockcharts.com
It is positive that Hi Yield Bonds moved higher and did not join the decline. Technology and Semiconductors led the decline. Gold only fell slightly, but most other sectors were weak, as last weeks decline was broad. Semiconductors and Technology were under selling pressure.
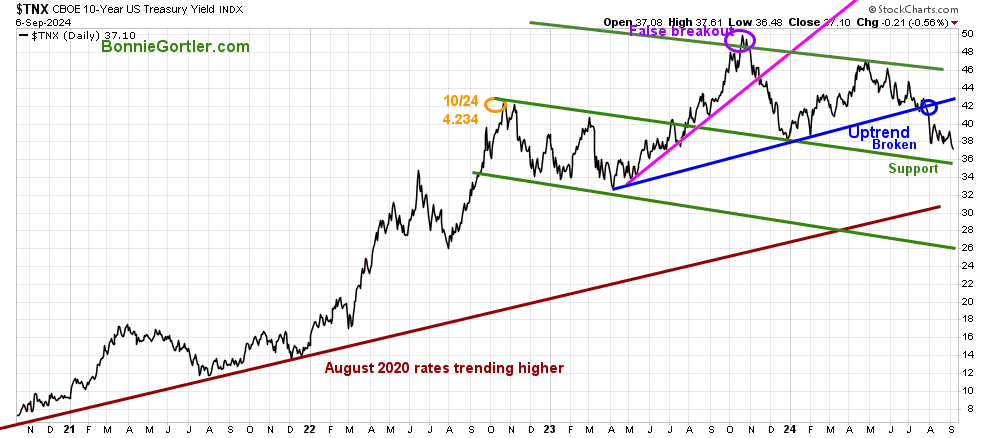
Figure 3: UST 10YR Bond Yields Daily
UST 10 Yr Bond Yields Daily
Source: Stockcharts.com
The 10-year U.S. Treasury declined last week, closing at 3.71%. Yields trending down have not helped U.S. Equities.
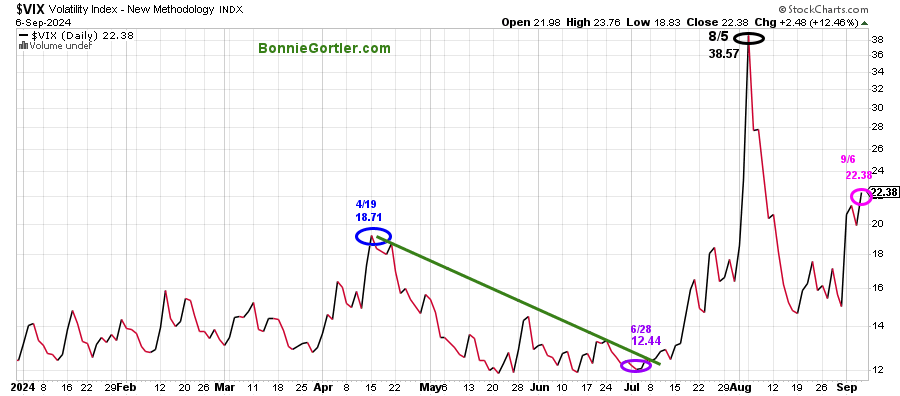
Figure 4: CBOE Volatility Index VIX
090624 Daily VIX
Source: Stockcharts.com
The CBOE Volatility Index (VIX), a measure of fear, is rising at 22.39, the second-highest close of 2024. If the VIX remains above 20.00 and continues to increase, be prepared for more significant daily swings.
The major market averages were all sharply lower last week. The Dow fell -2.93%, and the S&P 500 fell -4.25%. Both averages had their worst week since March 2023. The Nasdaq was down -5.77%, the worst week since 2022. The Russell 2000 Index fell -5.69%. The Valueline Arithmetic Average, which includes approximately 1700 stocks, also fell sharply by -4.49%, closing at 10294.89.
Weekly market breadth was negative on the New York Stock Exchange Index (NYSE) and for the Nasdaq. The NYSE had 842 advances and 2021 declines, with 437 new highs and 136 new lows. There were 1060 advances and 3462 declines on the Nasdaq, with 271 new highs and 359 new lows.
Are you interested in building your wealth? Discover how to implement a powerful wealth-building mindset and simple, reliable technical strategies to help you grow. Check out my eCourse Wealth Through Investing Made Simple. Learn more here.
Figure 5: New York Stock Exchange (NYSE) New Lows
090624 NYSE New lows Daily
Source: Stockcharts.com
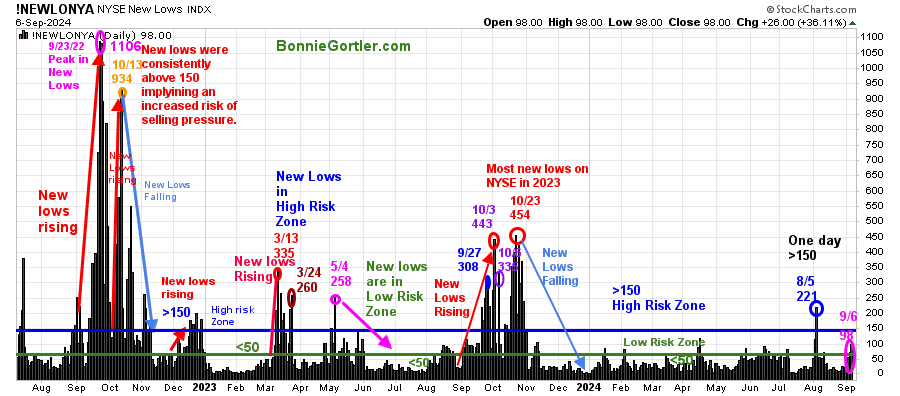
Watching New Lows on the New York Stock Exchange is a simple technical tool that helps increase awareness of the direction of an immediate trend.
For most of 2022, new lows warned of a potential sharp pullback, high volatility, and “panic selling,” closing above 150. The peak reading of New Lows in 2022 was on 9/23 at 1106, not exceeded in 2023. In 2024, New Lows have stayed below 150, and for a good part of the year below 50, a sign of a healthy market not expanding to levels that imply above-average risk. New Lows on the NYSE jumped to over 150 on 8/5/24, but the next day, New Lows contracted as the selling pressure subsided.
New Lows closed on 9/6/24 in the lower risk zone at 98 (pink circle). Watch New Lows closely this week. An increase above 150 would be a warning sign of the weakness continuing. A short-term bounce could begin if new lows fall between 25 and 50.
Learn more about the significance of New Lows in my book, Journey to Wealth, published on Amazon. If you would like a preview, get a free chapter here.
Figure 6: New York Stock Exchange (NYSE) (Top) NYSE New Highs (Bottom)
90624 NYSE Daily with NYSE New Highs
Source: Stockcharts.com
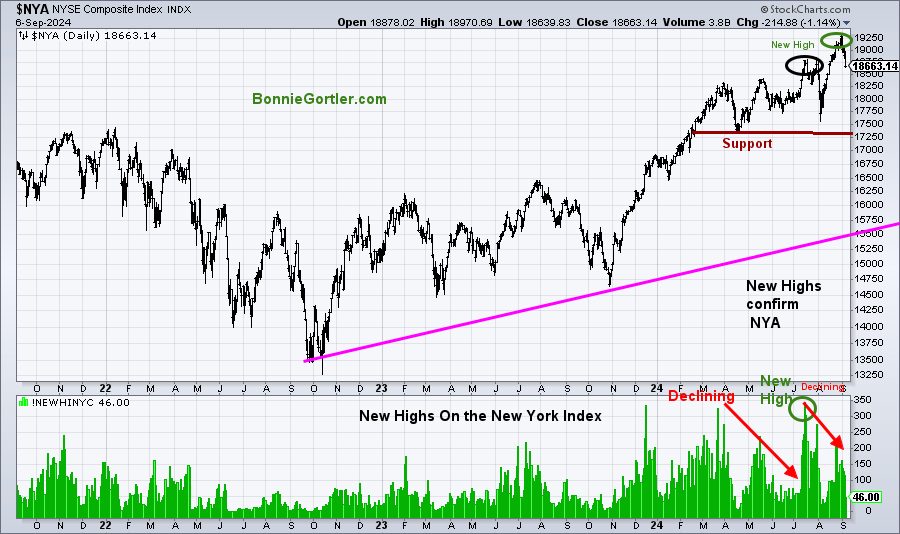
The New York Index joined the S&P 500, making a record high on 8/30/24. However, fewer stocks have made New Highs on the New York Stock Exchange since July. For strength in the short term, you want to begin to see more stocks on the New York Index making New Highs.
Key support below is 17250. A close below would imply the decline to accelerate.
Figure 7: Daily iShares Russell 2000 (IWM) Price (Top) and 12-26-9 MACD (Middle) and Money Flow (Bottom)
090624 Daily IWM
Source: Stockcharts.com
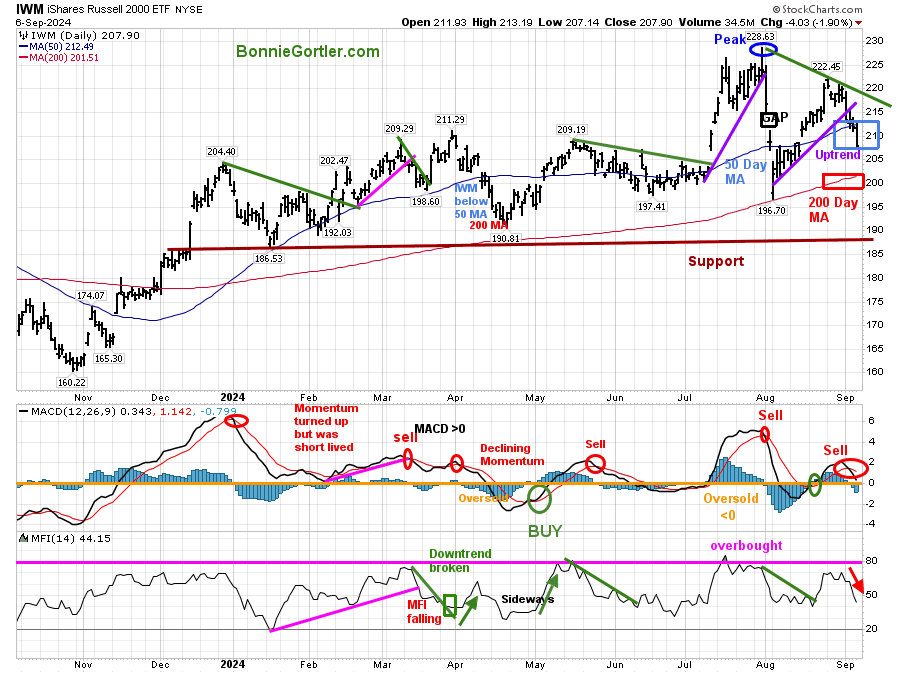
The top chart is the daily iShares Russell 2000 Index ETF (IWM), the benchmark for small-cap stocks, with a 50-Day Moving Average (M.A.) (blue rectangle) and 200-Day Moving Average (M.A.) (red rectangle) that traders watch and use to define trends.
IWM peaked on July 31 at 228.63. IWM broke the July uptrend and then fell below the 50-day M.A. In early August, IWM reversed the higher but failed to take out the high and turned it down.
IWM closed lower for the week at 200.87, falling -5.53%, closing below the 50-day M.A. IWM was weaker than the S&P 500.
Support is at 200.00, 197.00, and 187.00. Resistance is at 212.00, 220.00, and 225.00
MACD (middle chart) is on a sell. Momentum is weakening.
Money Flow (lower chart) is falling. With Momentum and Money Flow weak, there is no rush to invest in IWM. A better buying opportunity will occur over the next several weeks to months.
Figure 8: Daily Semiconductors (SMH) (Top) and 12-26-9 MACD (Middle) and Money Flow (Bottom)
090624 Daily SMH
Source: Stockcharts.com
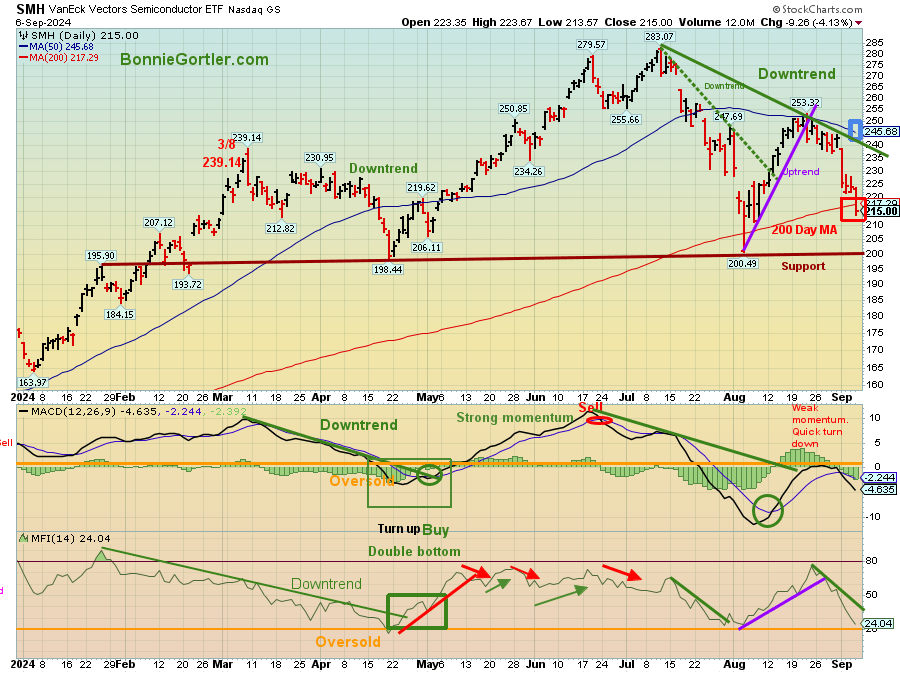
The top chart shows the Daily Semiconductors (SMH) ETF, concentrated mainly in US-based Mega-Cap Semiconductor companies. SMH tends to be a leading indicator for the market when investors are willing to take on increased risk, and the opposite is true when the market is falling.
The Semiconductor ETF (SMH) closed at 215.00, down -11.69% last week, its worst week since March 2020. SMH peaked in July and then recovered some of what it had lost in August. It is now testing the August low at 200.49. SMH closed below its 50-day (blue rectangle) Moving Average and 200-day M.A. (red rectangle), a sign of underlying weakness. SMH remains in its July downtrend. The SMH, having fallen below 235.00, negated the upside target of 320.00
Support is 200.00, 193.00, and 184.00. Resistance is at 220.00, 235.00, and 245.00.
MACD (middle chart) is on a sell, with not enough strength to get above 0 for a sell.
In the lower chart, the Money Flow Index (MFI) continues to fall after its overbought reading of 80 in August and trending down.
Further weakness in SMH will be negative for the broad market.
Figure 9: Weekly Semiconductors (SMH) (Top) and 12-26-9 MACD (Bottom)
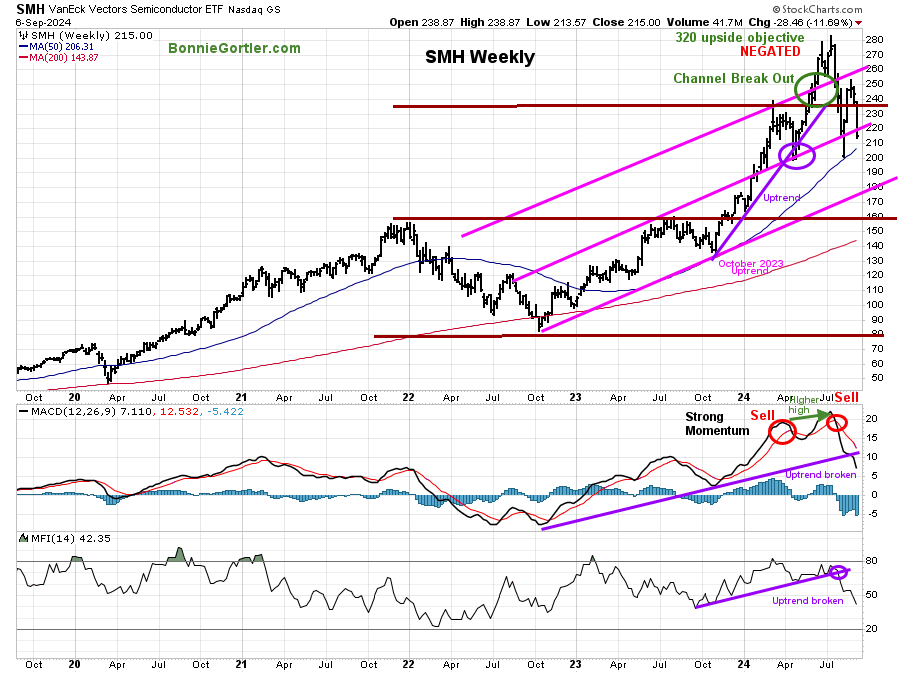
090624 Weekly SMH
Source: Stockcharts.com
The Semiconductors (SMH) broke out above the intermediate channel in April (green circle), giving an upside objective of 320.00. However, SMH peaked in July, followed by a failing rally. SMH fell below 232.00, negating the upside objective.
Nvidia (NVDA), the largest holding, 20.65% of SMH, fell by 13.86% last week, putting pressure on SMH.
MACD, a measure of momentum, remains on a sell, sharply falling momentum and has now broken the October 2022 uptrend.
Money Flow is falling, and its October 23 downtrend has broken.
SMH is due for a short-term bounce but is not likely to be sustainable as chart patterns are unfavorable for the short and intermediate term. A safer entry is likely to occur in 3-6 weeks.
If you like charts, then you will love my Facebook group. Join here: Wealth Through Market Charts.
Figure 10: Daily Invesco QQQ Trust (QQQ) Price (Top) and 12-26-9 MACD (Middle) and Money Flow (Bottom)

090624 Daily QQQ
Source: Stockcharts.com
The Chart shows the daily Invesco QQQ, an exchange-traded fund based on the Nasdaq 100 Index.
Nasdaq 100 (QQQ) fell -5.79% last week, closing at 448.09 below the 50-day M.A. (blue rectangle) but remaining above the 200-day M.A. (red rectangle).
Support is at 440.00, 430.00, and 410.00, the lower channel. Resistance is at 462.00, 472.00, and 486.00.
The bottom chart, MACD (12, 26, 9), is on a sell below 0 and falling.
Money flow (lower chart): MFI hit 80 in August and turned down as technology stocks have been under heavy selling pressure.
In Sum:
QQQ no longer shows strong leadership. Until downside momentum wanes, there is the risk of more selling in Technology stocks.
Figure 11: The S&P 500 Index (SPY) Daily (Top) and 12-26-9 MACD (Middle) and Money Flow (Bottom)
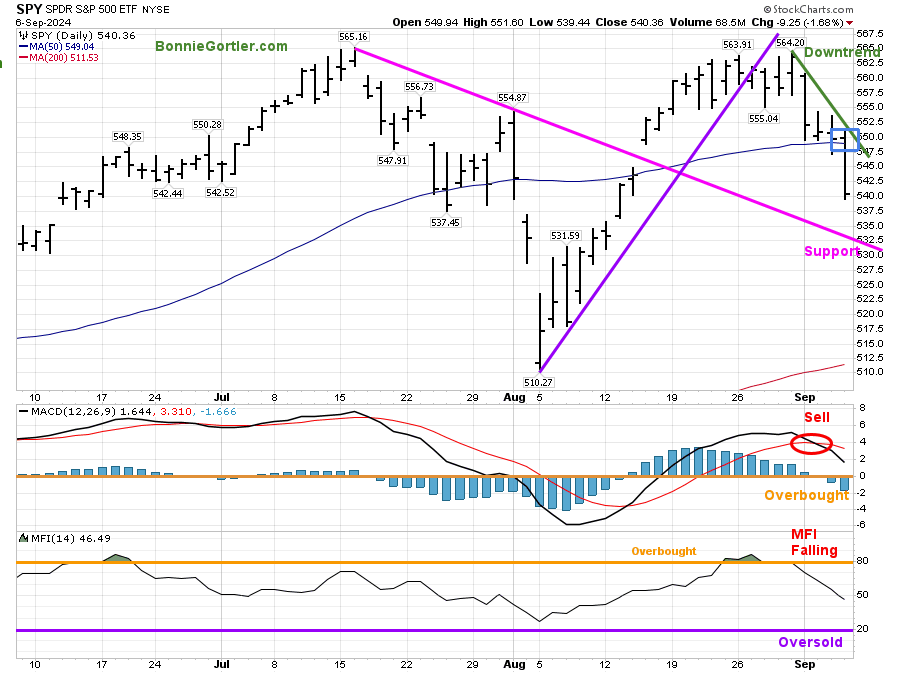
090624 Daily SPY
Source: Stockcharts.com
The SPY August uptrend (purple line) broke in late August,
SPY closed at 540.36, down -4.14%, closing below the 50-day Moving Average (blue rectangle), a sign of underlying weakness.
Support is at 532.50 and 512.50. Resistance is at 552.00 and 564.00.
MACD (middle chart) is on a sell above 0 and falling.
Money flow (bottom chart) turned down soon after getting above 80 in late August.
SPY closed weak on Friday. SPY is in a downtrend with weak momentum and no favorable buy patterns.
Summing Up:
Stocks closed near their session lows on Friday as selling pressure intensified after a weak jobs report. Technology and Semiconductor stocks led the decline. Daily and weekly momentum patterns are weakening. Daily volatility is on the rise. Tape action is poor. The risk of further downside remains until downside momentum subsides and daily and weekly chart patterns become more favorable. If you have not already done so, it’s time you review your portfolio and have a plan in place sooner rather than later if selling intensifies.
Remember to manage your risk, and your wealth will grow.
Let’s explore charts together. You are invited to schedule your Free 30-minute consultation by emailing me at Bonnie@BonnieGortler.com or scheduling a call here. I would love to connect with you.
Disclaimer: Although the information is made with a sincere effort for accuracy, it is not guaranteed that the information provided is a statement of fact. Nor can we guarantee the results of following any of the recommendations made herein. Readers are encouraged to meet with their own advisors to consider the suitability of investments for their own particular situations and for determination of their own risk levels. Past performance does not guarantee


Create more wealth in your life
with these simple strategies.
As an added bonus you will also
receive BG’s Updates and Ezine

Discover how to quickly create more well-being in your life with these simple strategies.
As an added bonus you will also
receive BG’s Updates and Ezine

As an added bonus you will receive BG’s Updates and Ezine

All work listed on BonnieGortler.com is licensed under a Creative Commons Attribution - Noncommercial - No Derivative Works 3.0 Unported License.
