

5 Investing Strategies to Save Money and Grow Wealth
04/11/2024
The S&P 500 (SPY), Nasdaq 100 (QQQ), and Russell 2000 (IWM) are all trading close to their highs near the top of their trading range. Our stock market timing models remain bullish even with favorable seasonality (the November through April period) coming to an end.
Declines are most likely to be contained, with any weakness viewed as a short term buying opportunity. Prices will soon either break down or up out of their trading range since the March lows. Each time the highs have been challenged it seems to be a one day wonder, where prices pause, failing to get through the top of the range and then prices fall temporarily, and another rally attempt begins. This will continue until we get more than a one day move to confirm that the trading range has broken. “Sell in May and go away” is all over the radio, TV, and internet. Historically the November to April period is a better period for investing, but it doesn’t mean there will be no opportunities now.
The international sector, especially many from developed countries are outperforming this year, and I believe this will continue (see the 04/20/15 newsletter) going forward. As long as the small-caps, financials and internationals are doing well, a significant decline in the S&P 500 is unlikely. The small caps have been acting better, not lagging like the Dow Jones Transportation Average and the Dow Jones Utility Average. The NYSE Advance/Decline Line has confirmed the recent high in the averages on 4/24/15. The new high in the NY Advance/Decline Line suggests the ultimate price top is several months away.
What Chart To Keep a Watchful Eye On?
SPDR S&P Biotech ETF (XBI) Weekly Price and Trend Channels (top), and 14 Week RSI (middle) and Tick
Volume (bottom)
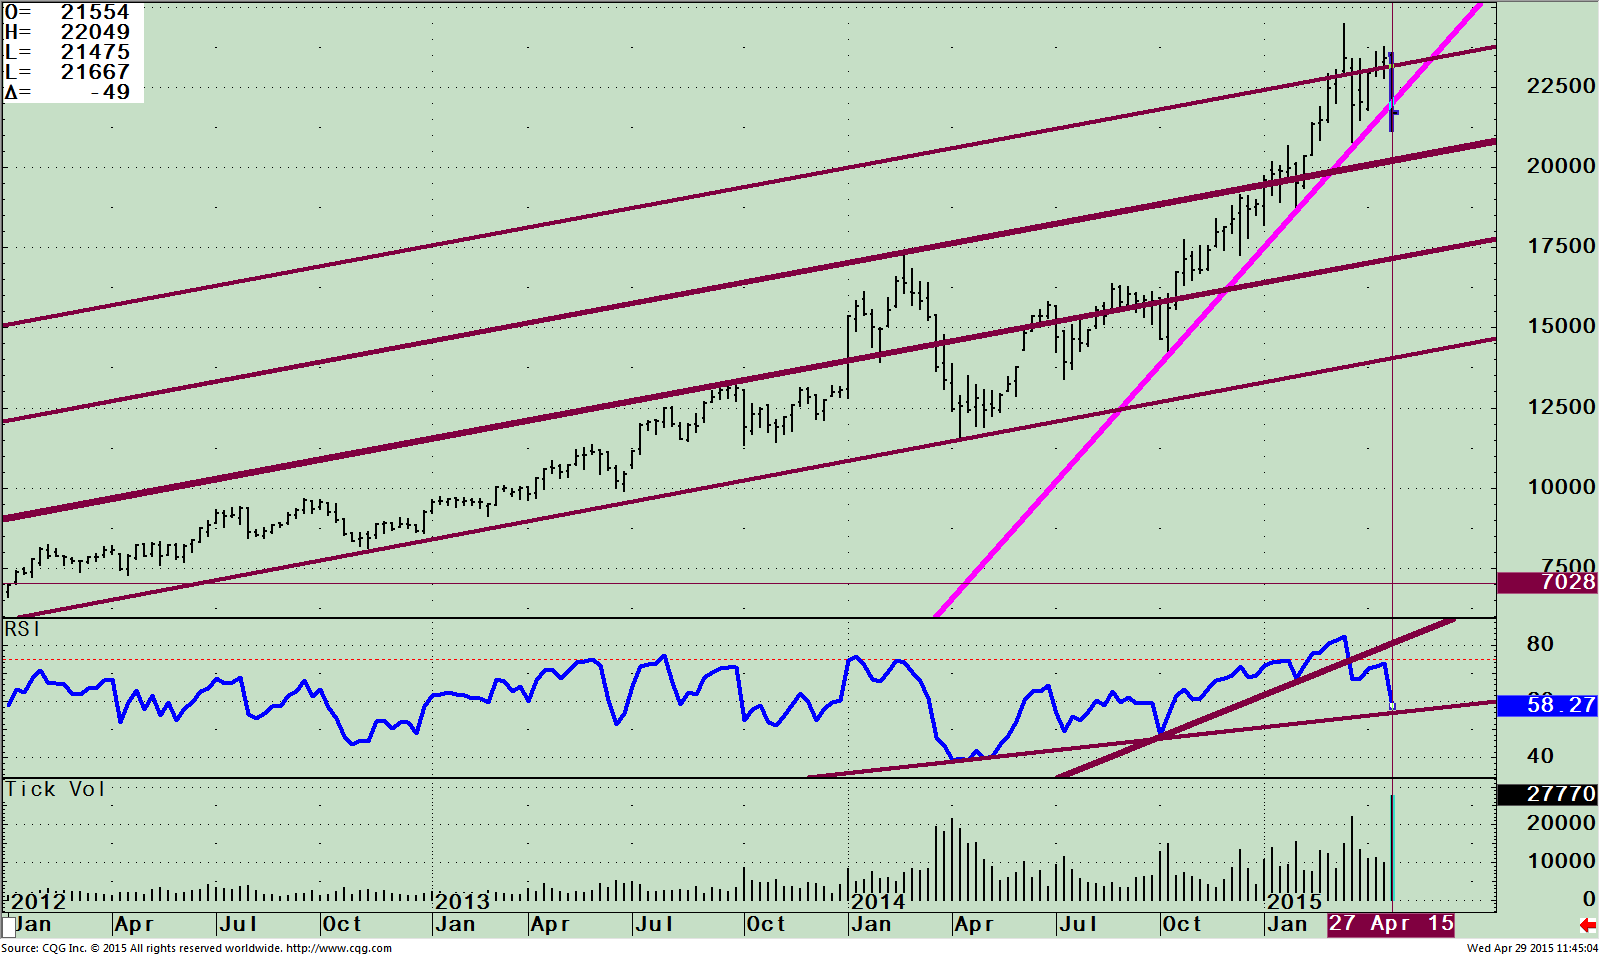
What has happened with biotechnology since the 4/16/2015 newsletter, only 14 days ago?
In the 04/16/15 issue I thought the easy money in biotechnology was over. The Relative Strength Index (RSI) uptrend showed weakening momentum including a trend line break which warned of a potential decline. A further decline didn’t materialize immediately, prices stabilized and rallied for a few weeks. Investors stepped in to buy after holding the low at 207.75 from. 03/23/15. The SPDR S&P Biotech Index ETF (XBI) rallied back to 237.60 but was unable to make a higher high peaking on April 24th (top chart on page 4). Prices fell 8.7% in just a few days breaking the uptrend from the October lows. The decline in XBI has switched the relative strength between XBI and S&P 500, now with the S&P 500 (SPY) being clearly stronger (chart not shown).
The Relative Strength Index (RSI, middle chart on page 4) is a measure of momentum developed by Welles Wilder. The middle chart has a double top and has already broken the shorter term uptrend. It is now very close to breaking the longer term trend line from April 2014. If broken, expect further weakness that could be could be sharp and fast.
The bottom chart is tick volume, a very useful technical analysis indicator that is confirming this decline could be more serious. Tick volume calculates each trade whether up or down and the volume that goes together with those trades for a specific time period. In this case it is weekly. I also find it very helpful for intra-day trading and short term trading. Tick volume is a useful tool to look for changes or continuation in trends. In this case, the volume spike looks to me like a change in trend from up to down.
Notice the large volume spike as prices fell on heavy volume. If prices were moving higher with a volume spike this would be bullish, but since prices are falling this is a clear warning sign that the high has been made and more profit taking will occur.
With the weekly trendIine already broken, a double top in RSI, and now a volume spike into falling prices on the weekly chart, expect the decline to accelerate quickly after 207.75 is penetrated to the channel support of 200.00 followed by 175.00.
On the daily chart (not shown) the volume was very heavy two days in a row confirming that the decline was not a one day wonder, there is increased risk in the biotech sector and possibly a very key downside reversal has taken place.
Just To Sum Up:
Biotech stocks have been a strong performer, a backbone supporting the overall market. The major averages have been trading towards the upper part of their trading range during the past two months. There hasn’t been enough strength or weakness to break out in either direction, but ultimately this will occur. While the trading range continues money is rotating in and out of different sectors. I am giving the market the benefit of doubt that the major averages will take out the highs. There are clear warning signals from additional technical indicators now that you no longer want to be passionate about the biotechnology sector, that the party is over, risk is increasing and caution is warranted. Investments in other sectors of the market including emerging markets, internationals, and small caps will be a better investment than biotechnology to have in your investment portfolio.
I invite you to share your stock market insights, questions or comments by calling me at 1-844-829-6229 or Email me at bgortler@signalert.com.


Create more wealth in your life
with these simple strategies.
As an added bonus you will also
receive BG’s Updates and Ezine

Discover how to quickly create more well-being in your life with these simple strategies.
As an added bonus you will also
receive BG’s Updates and Ezine

As an added bonus you will receive BG’s Updates and Ezine

All work listed on BonnieGortler.com is licensed under a Creative Commons Attribution - Noncommercial - No Derivative Works 3.0 Unported License.
