

5 Investing Strategies to Save Money and Grow Wealth
04/11/2024
UUneasiness was felt by investors entering the month of September, one of the worst months of the year historically. Many investors were waiting for a correction; however no decline of any magnitude occurred. They rarely happen when you are waiting for them. The market continues to climb the wall of worry. A new challenge is ahead, to get through October, a month where many sharp declines have begun in the past.
Some minor technical warning signals are appearing after the market breaking out of the consolidation pattern. There was some short term pressure on the market before the meeting of the Federal Open Market Committee (FOMC). They decided not to raise rates in September. A rally followed after the news to leave rates alone until at least December. When the major averages declined in September, the pull-back was short lived, key support levels held keeping the intermediate up trend in-tact.
The Good:
The Unknown:
What Charts You Want To Watch Now:
iShares Russell 2000 ETF (IWM) Weekly Price (Top), and 12-26-9 Week MACD (Bottom)
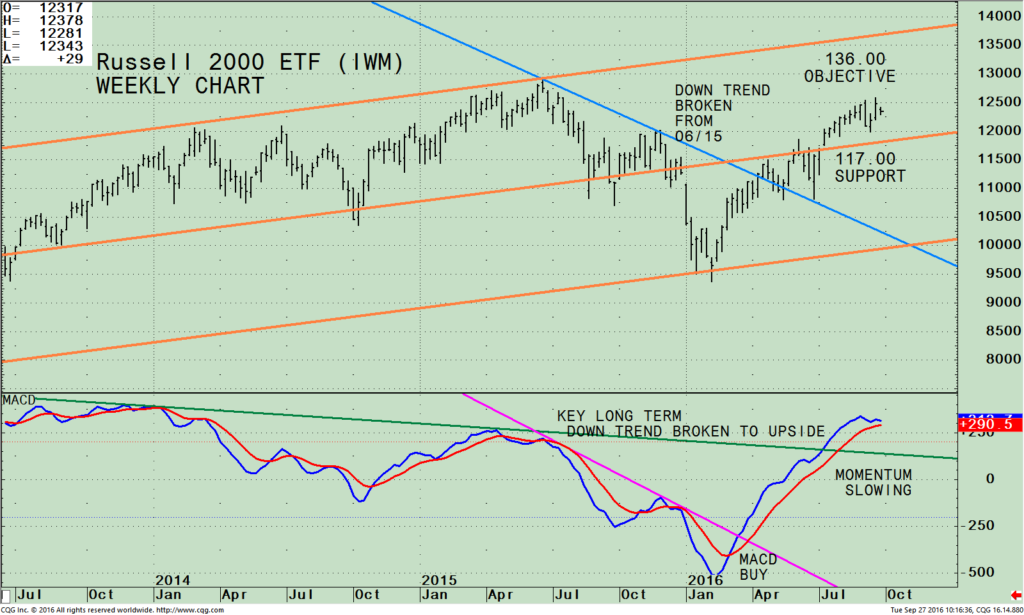
The top portion of the chart shows the weekly iShares Russell 2000 ETF (IWM) which is made up of companies with a market capitalization of between $300 million and $2 billion. The Russell 2000 (IWM) rose sharply after breaking the downtrend (blue line) on 04/18/16. The IWM is below the high made on 06/22/15 at 129.10, but has rallied above the mid channel that is now active as support. The upper channel objective is 138.00. As long as the IWM is above 117.00 higher prices are likely, however if it falls below for two days on a closing basis, the intermediate trend would be violated and the likelihood of a potential serious decline increases.
The lower portion of the chart is MACD, (a momentum indicator). The entry was timely, rising sharply after breaking the short term down trend (pink line). MACD remains on a buy, overbought but no negative divergence yet so I still consider it favorable. Momentum is slowing, yet above the long term down trend (green line) so the bulls are in control. Favorable seasonality for small caps will soon be upon us. It’s a good sign the small caps are stronger than the S&P 500 for the intermediate and long term.
Weekly (IWM) Russell 2000 Index / (SPY) S&P 500) Ratio (Top); 12-26-9 MACD of IWM/SPY Ratio (Bottom)
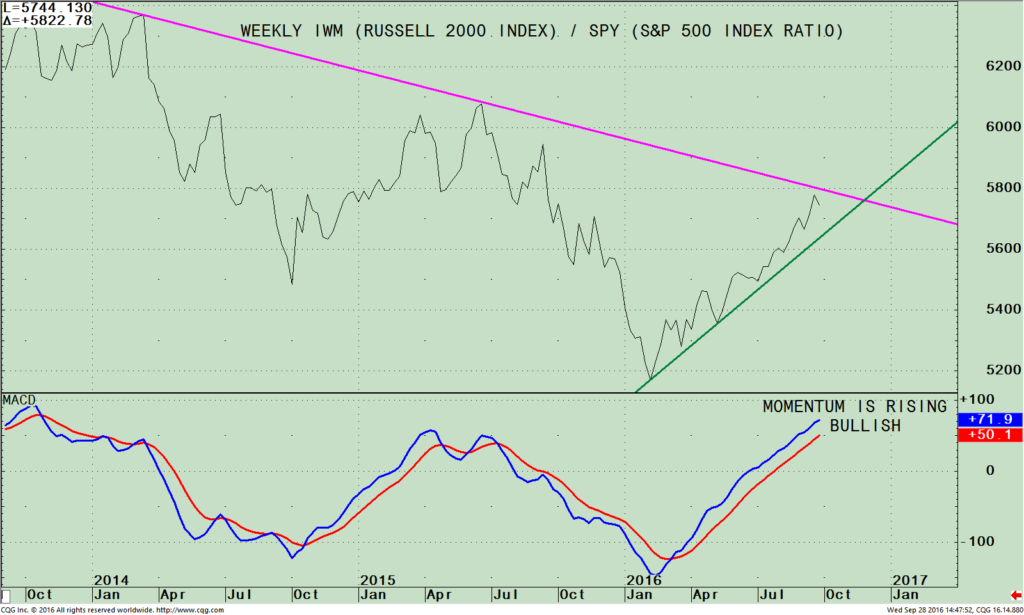
The top part of the chart is the Weekly Russell 2000 /S&P 500 (IWM/SPY ratio). A rising line means the IWM is stronger, and if falling, the S&P 500 is stronger. The IWM ratio has been steadily rising with a few small turn downs but holding above the up trendline since January 2016 (green line). The ratio last week turned down slightly, not yet breaking the longer term down trend line from February 2014 (pink line), still bullish. More strength in small caps compared to the S&P 500 would have a good chance of breaking the down trend and potentially could attract investors to take more risk and shift their assets out of other sectors. This would be favorable for the overall market.
Further weakness from here would be a warning sign a near term decline could begin.
The lower portion of the chart is the 12-26-9 MACD of the IWM/SPY ratio. Momentum is rising and at a new high, bullish.
Monthly (IWM) Russell 2000 Index / (SPY) S&P 500) Ratio (Top); 12-26-9 MACD of IWM/SPY Ratio (Bottom)
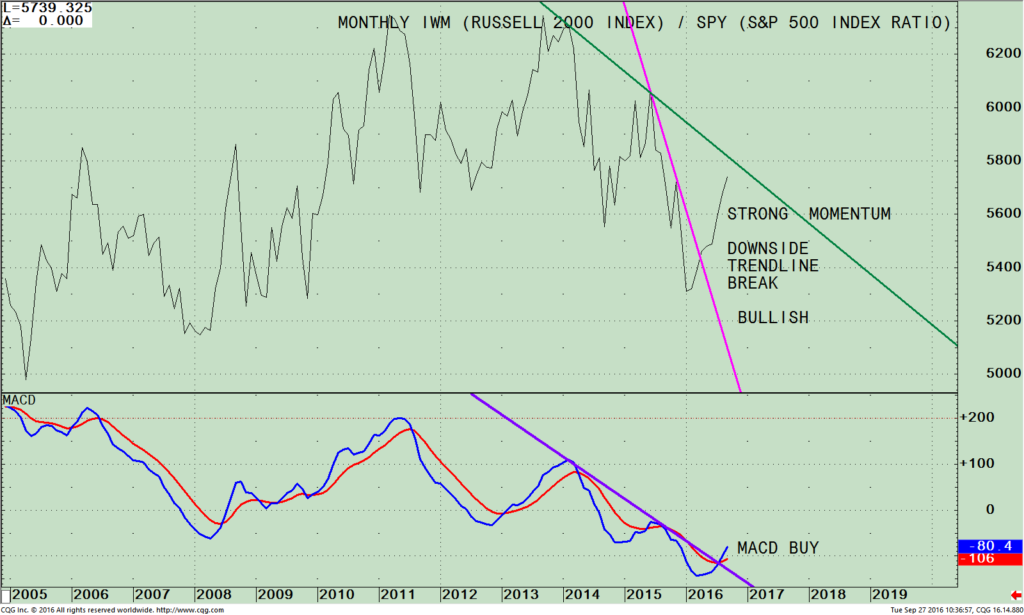
The top part of the chart is the monthly Russell 2000 /S&P 500 (IWM/SPY ratio). A rising line means the IWM is stronger, and if falling, the S&P 500 is stronger. Once again you see the Russell 2000 (IWM) is stronger than the S&P 500 (SPY). The rise is accelerating and if this persists the downtrend from January 2014 will be broken.
The lower portion of the chart is the 12-26-9 MACD of the IWM/SPY ratio. MACD has generated a buy, the best kind of signal, from an oversold condition. In addition there is also a downside trend line break suggesting more strength in the Russell 2000 compared to the S&P 500 will be seen.
Summing Up
The intermediate and long term momentum trend favors small caps (IWM) over the S&P 500 (SPY). This is bullish for the overall market. I am looking for the IWM to surpass its 2015 high and potentially reach the upper channel objective of 138.00. As long as the IWM is above 117.00 higher prices are likely, however if it falls below for two days on a closing basis, the intermediate trend would be violated and the odds of a potential serious decline increases. If you are lightly invested and looking to add to your investments, the long term trend favors small caps over the S&P 500 (SPY). Small caps are the investment of choice.
I would love to hear from you. Please call me at 516-829-6444 or email at bgortler@signalert.com sharing your thoughts, or ask me any questions you might have.
If you like this article, then you will love this!
Click here for a free report: Top 10 investing Tips to More Wealth
*******Article in Systems and Forecasts Sept 30, 2016

Discover the right wealth building attitude…
Download a Free chapter of my book Journey To Wealth
Disclaimer: Although the information is made with a sincere effort for accuracy, it is not guaranteed that the information provided is a statement of fact. Nor can we guarantee the results of following any of the recommendations made herein. Readers are encouraged to meet with their own advisors to consider the suitability of investments for their own particular situations and for determination of their own risk levels. Past performance does not guarantee any future results.


Create more wealth in your life
with these simple strategies.
As an added bonus you will also
receive BG’s Updates and Ezine

Discover how to quickly create more well-being in your life with these simple strategies.
As an added bonus you will also
receive BG’s Updates and Ezine

As an added bonus you will receive BG’s Updates and Ezine

All work listed on BonnieGortler.com is licensed under a Creative Commons Attribution - Noncommercial - No Derivative Works 3.0 Unported License.
