

5 Investing Strategies to Save Money and Grow Wealth
04/11/2024
Day-to-day volatility is extremely low, as the summer winds down and the election looms. Over the past 25 days the daily price movement range is slightly lower than two weeks ago, 0.26% – 0.31% for the S&P 500, Russell 2000, and the Nasdaq 100. Investors will keep in the back of their minds (including myself), the potential rate hike in order to decide how much risk they want to bear. The rise could come in September even though it’s unlikely. December is more of a possibility, or even early in 2017.
The major averages are trading near their highs. There has been profit taking in Utilities and Real Estate after their strong performances this year. During the month of August, Emerging Markets, Financials, Nasdaq, Midcap and Small Cap areas were all more profitable than the S&P 500. I am expecting downside risk to be contained in the months ahead, as long as no unexpected news of a sharp rise in interest rates. If a change in investor’s perception from bullish to bearish does take place, volatility will increase quickly and prices will fall quickly.
Over the next several weeks I recommend you to watch the small cap sector very closely for a potential change in the intermediate trend that has been clearly up. If the IWM lags the S&P 500 a warning sign will be given of a potential change in the intermediate trend.
What Charts You Want To Watch Now:
iShares Russell 2000 ETF (IWM) Weekly Price (Top), and 12-26 Week MACD (Bottom)
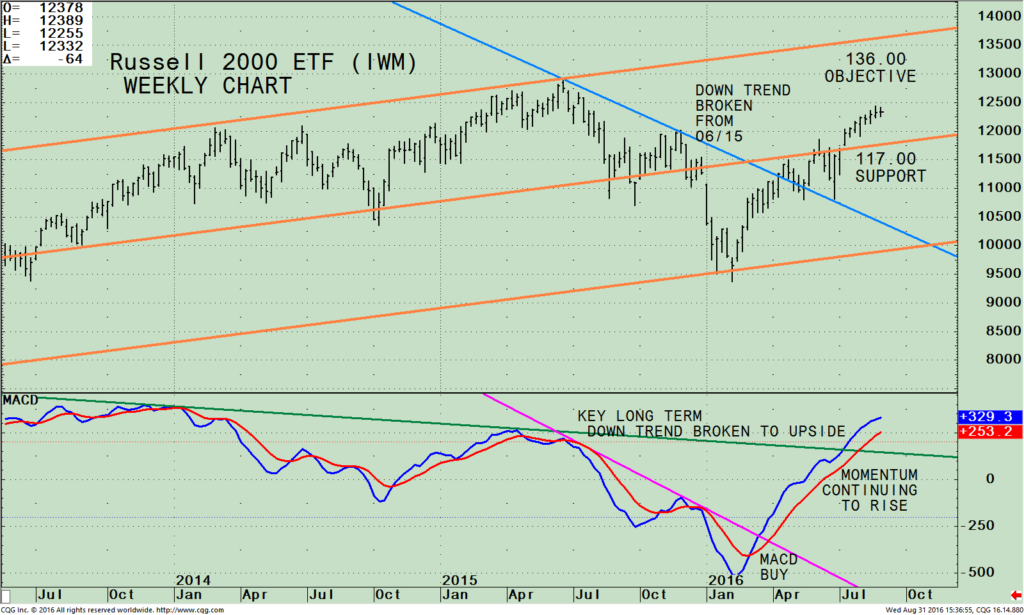
The top portion of the chart shows the weekly iShares Russell 2000 ETF (IWM) which is made up of companies with a market capitalization of between $300 million and $2 billion. The Russell 2000 (IWM) peaked on 06/22/15 at 129.10. After finding a bottom, the Russell 2000 (IWM) rose sharply breaking the downtrend on 04/18/16 (blue line). The IWM rallied, and then paused for a few weeks retracing some of its gains, testing the downtrend line. The IWM then broke through resistance at 117.00, the mid channel. The upper channel objective is 138.00. If the IWM instead stalls from here, 117.00, the old resistance will act as support.
As long as the IWM is above 117.00 I would expect higher prices. If the IWM falls, and breaks below 117 for two days on a closing basis, this would not be a good sign and the intermediate trend would be in jeopardy.
The lower portion of the chart is MACD, (a momentum indicator). MACD generated a great entry from an oversold condition, rose sharply breaking the short term trend line (pink line), and has never looked back. More good news is the long term down trend since December 2013 (green line) has turned favorable, which supports the bullish case and will support the market. Favorable seasonality is also only a few months away for small caps. Investors might be ready to shift their assets and take on more risk by reducing their holdings in large cap and dividend paying stocks that are somewhat extended and overvalued.
Even if the IWM turned down now, I would not expect it to be long lived and become a major decline after the strength of the momentum and the longer term breakout that has occurred. If there is a 2-3% pullback this would be an ideal area to buy.
Weekly (IWM) Russell 2000 Index / (SPY) S&P 500) Ratio (Top); MACD of IWM/SPY Ratio (Bottom)
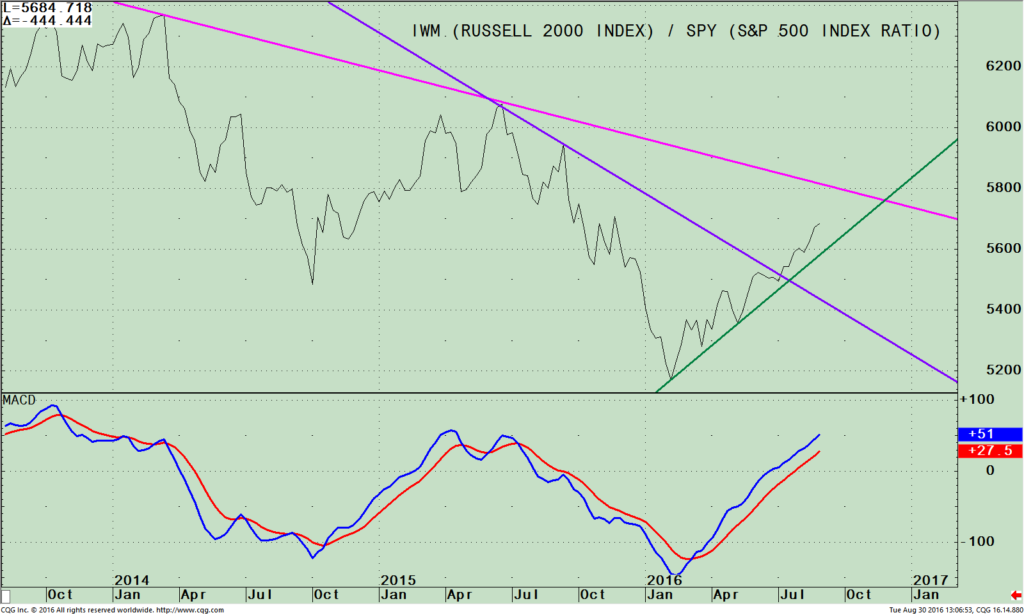
The top part of the chart on the right is the Weekly Russell 2000 /S&P 500 (IWM/SPY ratio). A rising line means the IWM is stronger, and if falling, the S&P 500 is stronger. The IWM is clearly leading in relative strength confirming the rise in the IWM. The downtrend has been broken from June 2015 and could very well break the longer term trend from February 2014 if the small caps continue to be stronger than the S&P 500. A turn down and break of the uptrend would not be a good sign.
The lower portion of the chart is MACD of the IWM/SPY ratio, still rising, no weakening momentum of at this time. The IWM/SPY ratio is almost at new highs and there are no negative divergences, bullish.
Summing Up:
Day-to-day volatility was extremely low in August but this could change fast. The intermediate trend remains up supporting the market and the bulls remain in control for now. Our models remain favorable. I believe the advance will continue however I am recommending watching the Russell 2000 (IWM) for direction to see if the IWM rises further to the top of the channel at 136.00. If the IWM falls instead and breaks below support at 117.00 for two days on a closing basis the retracement could be the warning that the intermediate rising trend is over and a decline is ahead. It’s a good time to review your investment portfolio and have your exit strategy ready in case the unexpected occurs, and the bears come out of hiding.
I would love to hear from you. Please call me at 516-829-6444 or email at bgortler@signalert.com sharing your thoughts, or ask me any questions you might have.
If you like this article, then you will love this! Click here for a free report: Top 10 investing tips to more wealth.
*******Article in Systems and Forecasts Sept 01, 2016

Discover the right wealth building attitude…
Download a Free chapter of my book Journey To Wealth
Disclaimer: This is a hypothetical result and is not meant to represent the actual performance of any particular investment. Future results cannot be guaranteed. Although the information is made with a sincere effort for accuracy, it is not guaranteed either in any form that the above information is a statement of fact, of opinion, or the result of following any of the recommendations made herein. Readers are encouraged to meet with their own advisers to consider the suitability of investments discussed above for their own particular situations and for determination of their own risk levels.


Create more wealth in your life
with these simple strategies.
As an added bonus you will also
receive BG’s Updates and Ezine

Discover how to quickly create more well-being in your life with these simple strategies.
As an added bonus you will also
receive BG’s Updates and Ezine

As an added bonus you will receive BG’s Updates and Ezine

All work listed on BonnieGortler.com is licensed under a Creative Commons Attribution - Noncommercial - No Derivative Works 3.0 Unported License.
