

5 Investing Strategies to Save Money and Grow Wealth
04/11/2024
The Dow, S&P 500, and Nasdaq suffered their 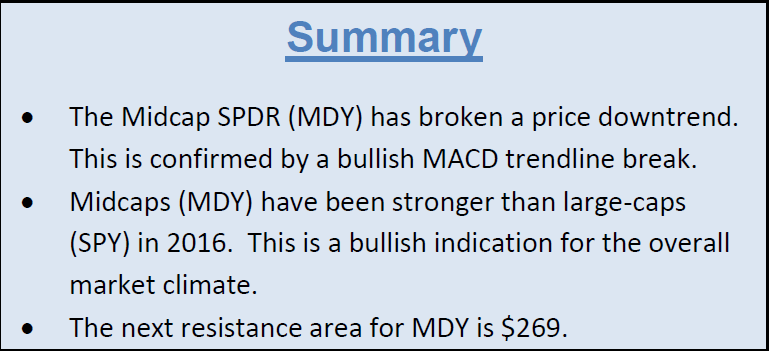 first weekly loss in the past six weeks.The pullback was small, short lived and is a healthy consolidation that worked off their overbought condition, with the market not giving up much ground. The latest rise from the February low is looking more than a relief rally even though it is on low volume. The international markets were also strong in March, helped by their undervaluation compared to the U.S. market, attracting interest and increased money flow from investors. Some of the top performers were Brazil (EWZ),
India, (EPI) Korea (EWY) and Emerging Markets (EEM), all up over 13% through 03/30/16.
The market remains very resilient, climbing the wall of worry with the possibility of higher interest rates, a volatile oil market and world events that are unforeseen. April has a bullish bias, one of the best performing months of the year historically. Our models remain positive suggesting above-average profit potential with risk well below
average. Market breadth, favorable tape action, and a new development, potential leadership in midcaps, lead me to remain optimistic for the near term.
Chart to Monitor: The SPDR MIDCAP 400 (MDY) (Top) and 12-26 Week MACD (Bottom)
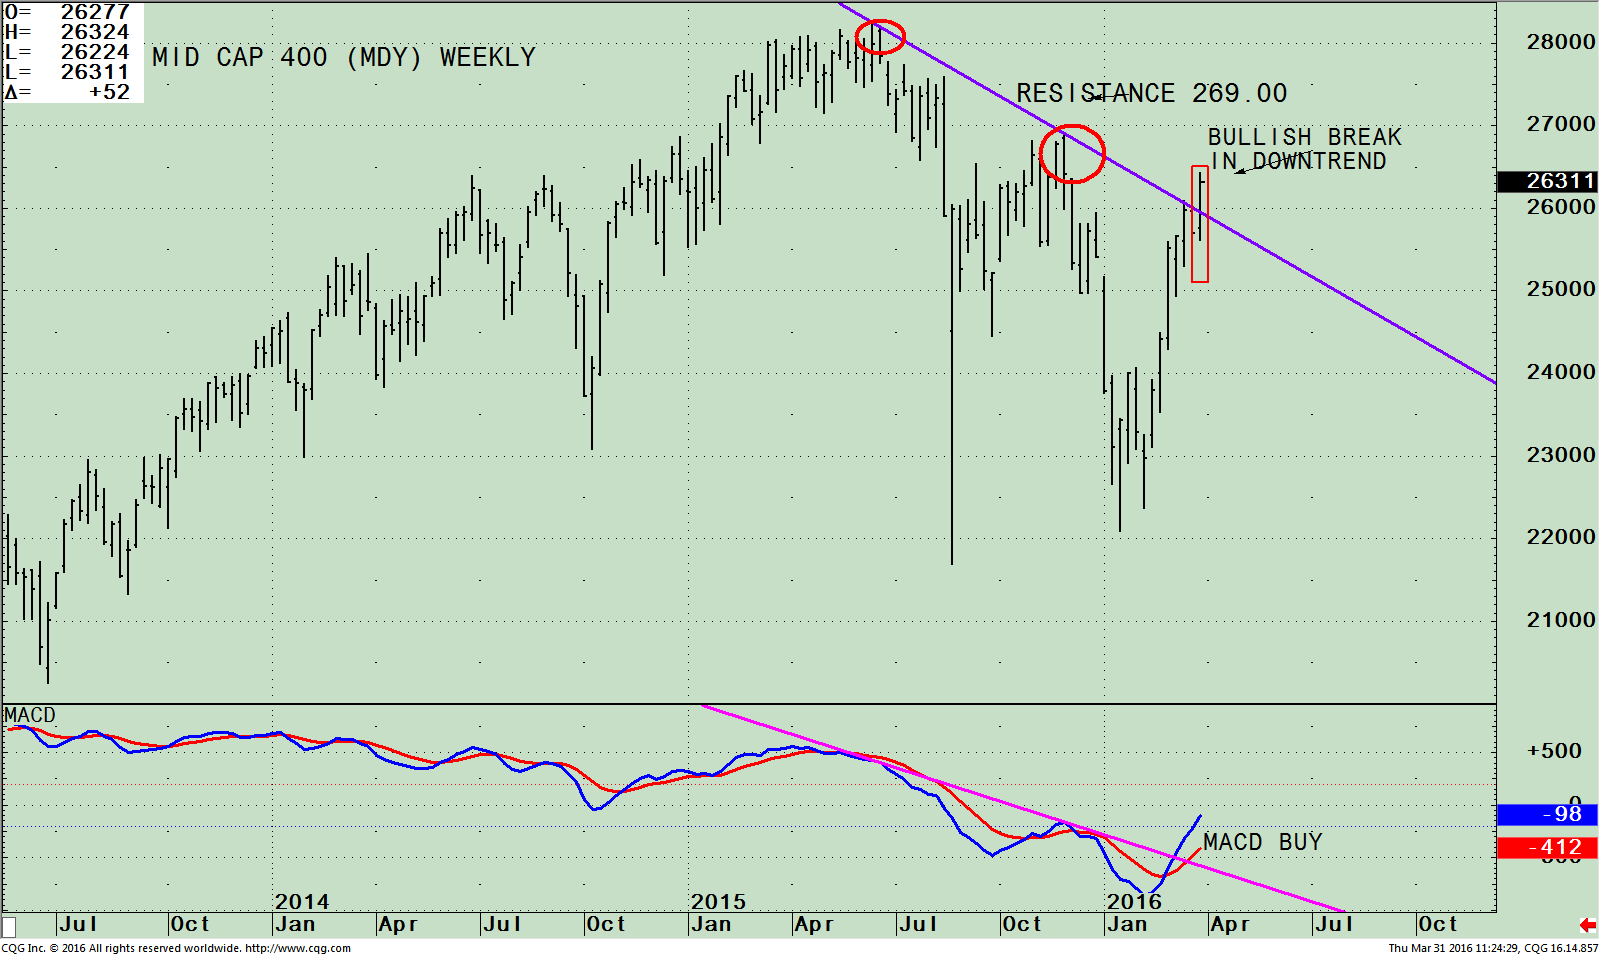
The top chart is the weekly SPDR S&P Midcap 400 ETF (MDY). MDY is composed of 400 selected stocks listed on national stock exchanges with a market cap in the range of US $1 billion to US $4.5 billion. As of 3/30/16 the index is made of 24.85% Financials, 16.19% Information Technology, 15.40 % Industrials and 13.45% Consumer Discretionary. The largest holding is only 0.84%; therefore no one stock has a large impact on the movement of the index.
MDY peaked in June 2015 before undergoing an eight-month correction. MDY successfully tested its January lows in February. The price chart above shows that the downtrend from June through November 2015 has been broken to the upside this week. This breakout to the upside is bullish for the overall stock market because midcaps are participating in the rally rather than lagging the advance. MDY closed at 263.28 on 03/30/16. Short-
term support is 259.00. Resistance is at 269.00. If the MDY breaks through resistance, new upside projections to 280.00 would be given.
The bottom half of the chart shows the 12-26 MACD, (a measure of momentum), turning up after making lower lows, generating a buy. MACD broke the downtrend from March 2016 (pink line) confirming the breakout in price, already above the November 2015 MACD highs. This indicates the MDY is gaining momentum and higher prices lie ahead.
On a side note, another positive sign is that the S&P 500 has penetrated short term resistance at 204.00. In addition, on the pullback declines were contained to less than 2%. The S&P 500 (SPY) has also broken its weekly downtrend. This makes it possible that SPY could challenge the upper channel discussed in the 03/17/16 newsletter between 212.00 and 214.00. If penetrated, more buyers will step in. The S&P objective of 228.00
corresponds to the upside objective of 280.00 for the MDY.
Weekly MDY/ (SPY) Ratio (Top); 12-26 MACD of MACD/SPY Ratio (Bottom)
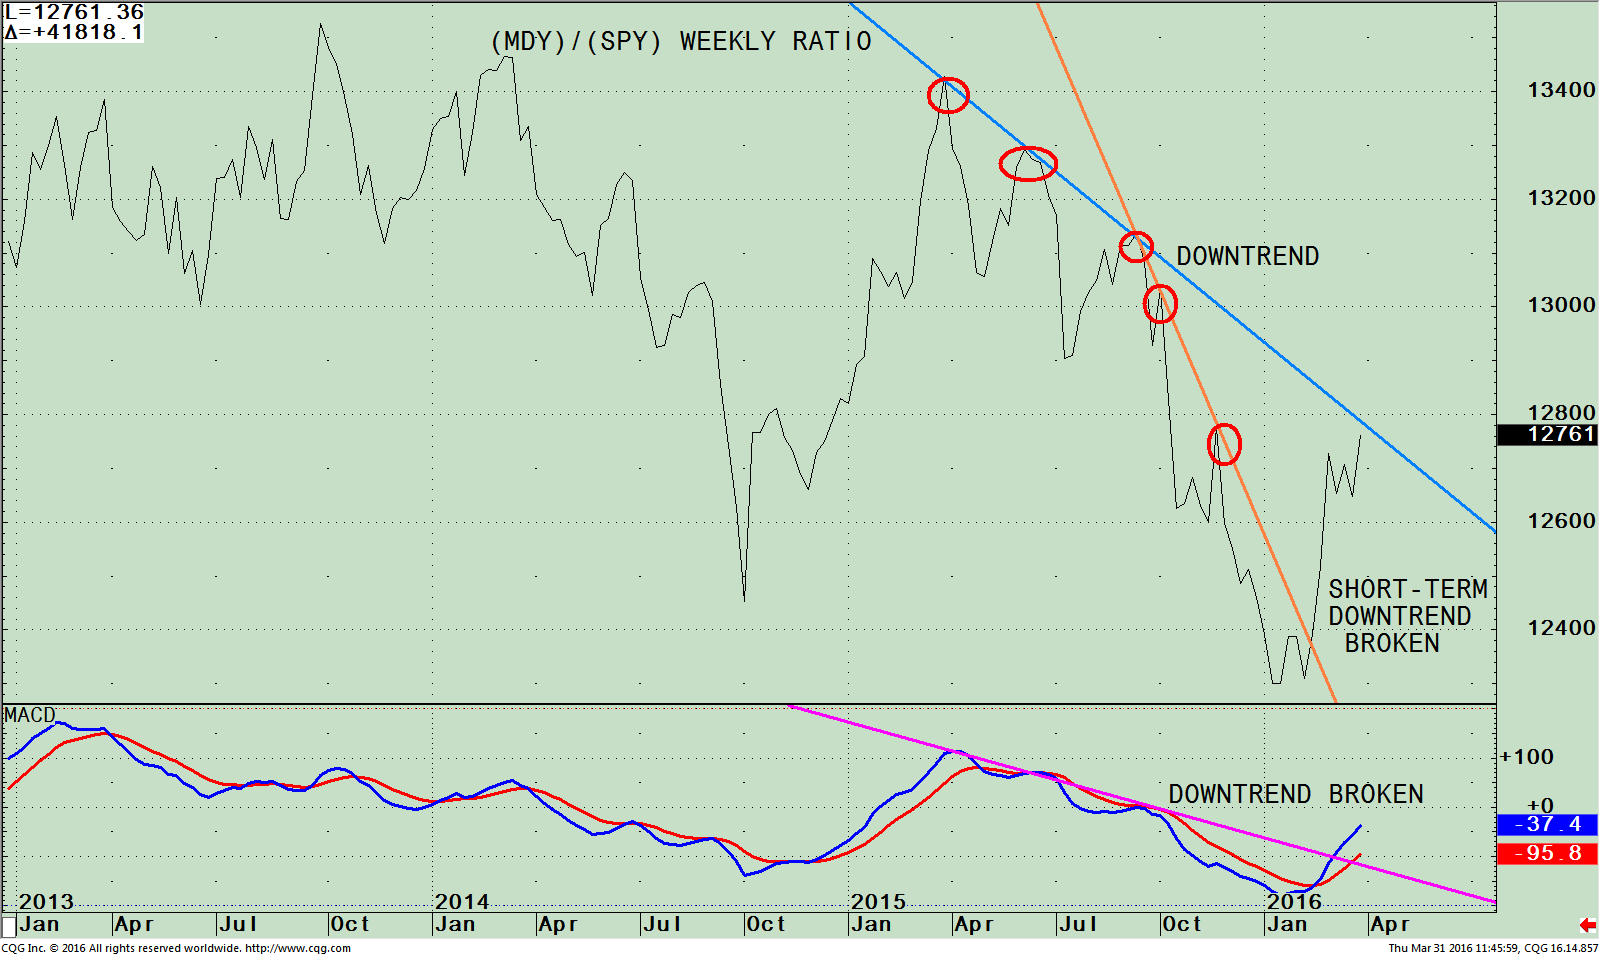
The top part of the chart is the weekly ratio MDY / SPY (midcaps to large-cap ratio). A rising line indicates that MDY is stronger, and if falling, the S&P 500 (SPY) is stronger. The MDY/SPY ratio peaked in March 2015.
Continuous lower highs were made into early 2016 (see the red circles). Midcaps are now showing signs of life improving in relative strength, outperforming the S&P 500 (SPY) since early February 2016, and breaking the short term downtrend.
The lower portion of the chart is MACD of the MDY/SPY ratio. The pattern is clearly showing positive momentum with MACD already generating a buy and the downtrend broken (Pink Line). This is bullish.
Will the MDY/SPY be able to penetrate the downtrend from the peak that has formed? I believe yes, sooner rather than later because the MDY/SPY relative strength ratio in the lower portion of the chart has already broken the downside trendline.
Summing Up:
The bulls remain in control as the market climbs the wall of worry. Our models have steadily been improving, now positive (bullish), meaning most favorable, above-average profit potential with risk well below average. The odds favor the U.S. market moving higher. Sector rotation into mid-caps appears to be taking place after being out of favor since June 2015. There is continued disbelief in the rally as the quarter comes to a close, the best type of market advance. Monitor the Midcap 400 Index ETF (MDY) to see if price can get through resistance 269.00. The odds favor the MDY to break through resistance giving upside projections to 280.00.
I welcome you to call me with any comments, feedback or questions at 516.829.6444 or email bgortler@signalert.com.
*******Article in Systems and Forecasts April 01, 2016


Create more wealth in your life
with these simple strategies.
As an added bonus you will also
receive BG’s Updates and Ezine

Discover how to quickly create more well-being in your life with these simple strategies.
As an added bonus you will also
receive BG’s Updates and Ezine

As an added bonus you will receive BG’s Updates and Ezine

All work listed on BonnieGortler.com is licensed under a Creative Commons Attribution - Noncommercial - No Derivative Works 3.0 Unported License.
