

5 Investing Strategies to Save Money and Grow Wealth
04/11/2024
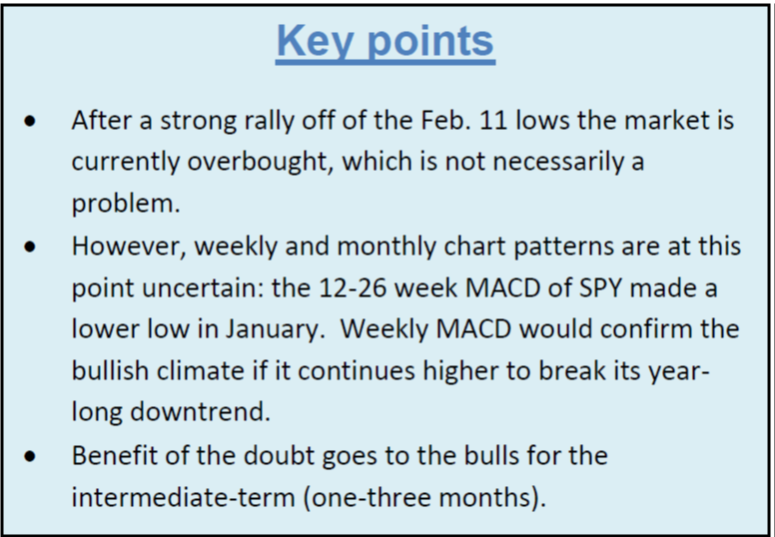 Investors’ fears disappeared quickly when an appetite for bargain prices outweighed worrying about a potentially possible serious decline forthcoming. The stock market proceeded to rally broadly, very strong tape action with extraordinary breadth that has accompanied the rise which has not been seen for many years. If market breadth remains favorable (more net advances than declines consistently), then higher gains are likely. The S&P 500 (SPY) has gained 11% from its lows on 02/11/16.
The global markets also participated in the
advance. In particular, emerging markets are performing better. There has been an uptick in relative strength compared to the S&P 500, (EEM/SPY) after peaking 5 years ago. It’s still early to tell if this will be the time that another failure in strength takes place, which has been the case in the last few rally attempts, or if the emerging markets keep going, and potentially even lead the US market higher.
Investors have purchased securities that were very weak during the decline. Materials, financials, gold, silver, energy and international stocks have come alive, encouraging signs for further rise. Brazil (EWZ) is up 16%, (had been up 26%) Spain (EWP) Italy (EWI) and India (EWI) are all up over 9% in March. China (FXI), Emerging Markets (EEM), Russia (RSX), Germany (EWG) and Korea (EWY) are all up over 7% month to date (through 03/15/16).
Our models have steadily been improving, now positive (bullish), meaning most favorable, above-average profit potential with risk well below average.
The odds favor the U.S. market moving higher. However the advance might be ahead of itself and need more base building before they work their way higher. Also expect further sector rotation to be the focus in the next few weeks, with investors and institutions’ rebalancing their portfolios as the quarter comes to a close. The best type of market advance is the one that price makes higher highs and higher lows and price doesn’t give up much ground on declines, 1 or 2%, only minor pullbacks. A larger decline wouldn’t be encouraging. If overhead resistance is penetrated then a breakout to the upside would occur.
More time is needed to tell what the outcome will be.
The biggest concern to me is the technical damage that was done during the decline earlier in the year. Longer term monthly charts still remains front and center to my eyes with all the upside trend lines that were broken.
For example, Biotech, the Valueline Composite Geometric Average, and the weakening momentum warning of the S&P 500 QQQ/SPY ratio (see my article in the 02/18/16 newsletter) of the MACD of the RSI, all had disturbing trendline breaks.
Another question I keep asking now that the Dow and the S&P 500 (SPY) have had a slight penetration above their 200-day moving average is, will the bulls stay in control like they have the last few weeks, and the market break out to the upside, or will the bears will come out of hibernation and the rally will fail? Another important question “Was the latest rise from the February low a relief rally or something more?” Even with the all clear message from our models and the global markets participating in the advance, I am not totally convinced that the market is out of the woods yet. I would like to see the S&P 500 (SPY) fall no more than 2%, turn up and penetrate the overhead resistance for the charts to confirm the potential bullish outcome (see below) that could arise. If the market does fall further the S&P (SPY) needs to hold above 195.00.
What Are The Charts Saying?
The SPDR S&P 500 (SPY) Weekly With Channel (Top) and 12-26 Week MACD (Bottom)
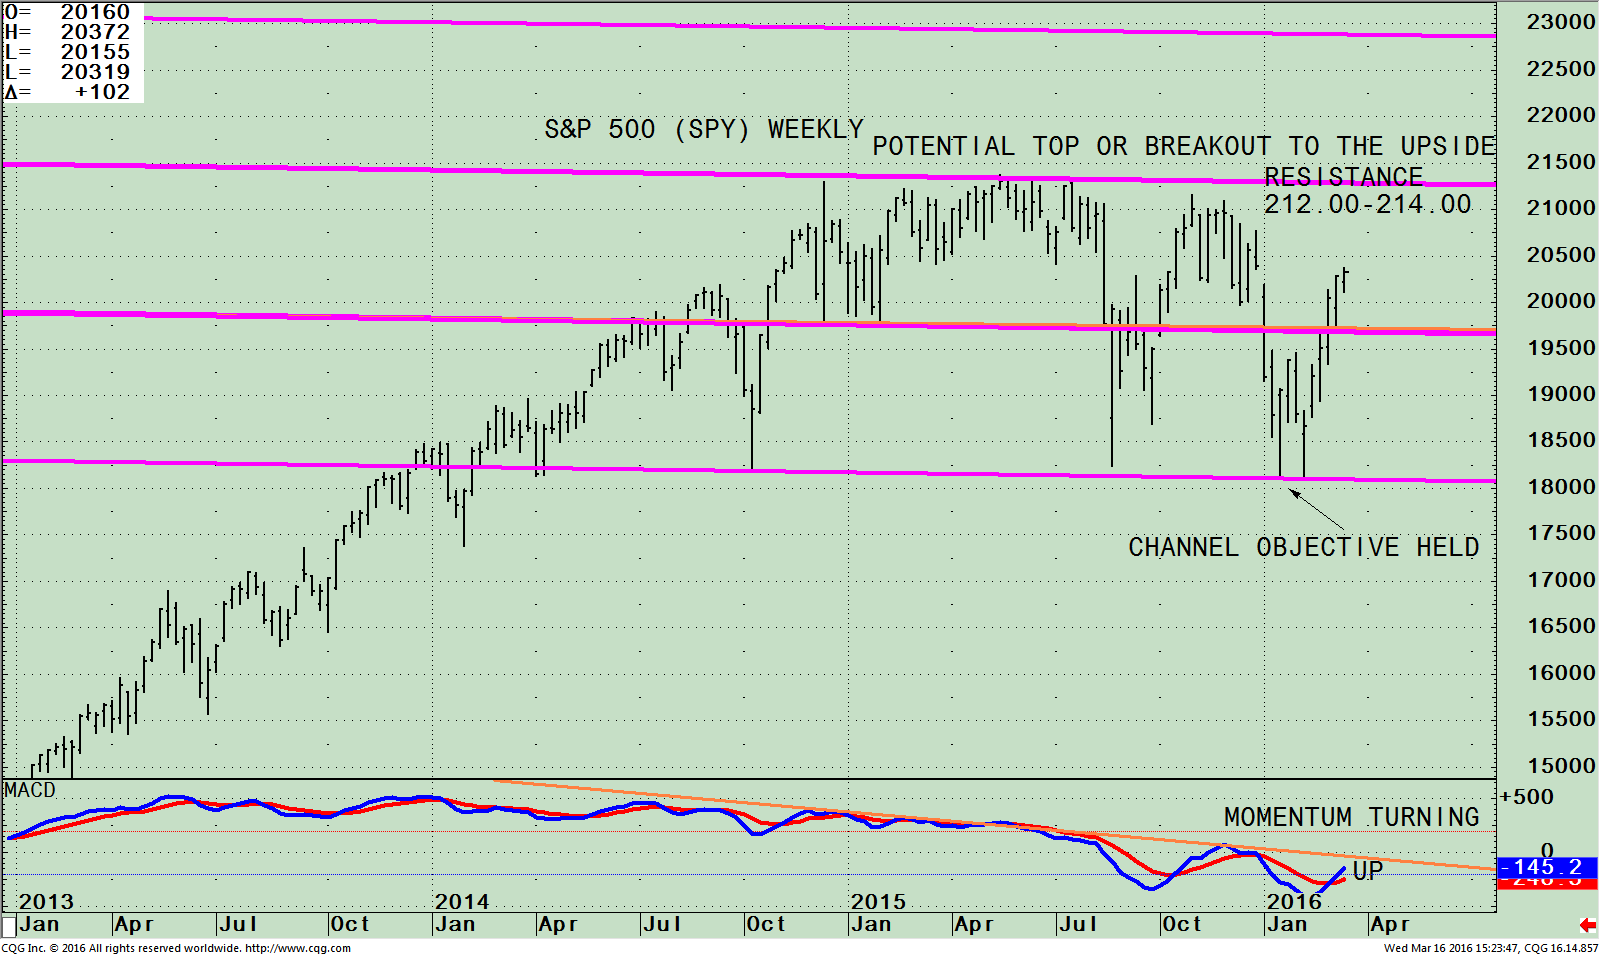
The top chart is the weekly SPDR S&P 500 (SPY) ETF that is comprised of 500 stocks of the largest companies in the U.S. As of 01/05/16 its top 4 holdings in the S&P 500 were Apple Inc. (AAPL) 3.21%, Microsoft Corporation (MSFT) 2.39%, Exxon Mobil Corporation (XOM), 1.93% and General Electric (GE) 1.66%.
SPY was near its lower channel five weeks ago, successfully testing the August 24 and January 19th lows. The S&P 500 (SPY) recovered 11% moving through the middle channel with ease, and now could be ready to challenge the top of the channel. For the very short term, a break above 204.00 will get the bulls interested again and a break below 200.00 may bring out the sellers. A breakout would occur if the S&P 500 could get through the critical point of resistance between 212.00 and 214.00 giving a higher objective to 228.00. If the market stalls and turns down from here, then goes below the middle channel, this would not be a good sign. The fear is the pattern on the S&P 500 (SPY) might be a significant top formation spread over time that could have serious implications going forward. Potentially the lows would be tested and this time the decline could be worse, projecting down to 165.00. For now, the decline has been contained and I give the benefit of the doubt to the bulls. I will be watching closely the action of the S&P 500 (SPY) in case the bear comes out of hiding and once again takes charge.
The bottom half of the chart shows MACD, a measure of momentum. MACD, although on a buy, the downtrend from May 2015 remains in effect (orange line). A bullish sign would be if MACD keeps rising and the down trend is broken sooner rather than later, and goes above the November MACD highs. This would indicate that the SPY is gaining momentum and higher prices lie ahead.
In our 01/08/16 Systems and Forecasts newsletter when the market started to fall fast I raised the question, “Will the decline continue, or will the market turn up from here? “ I gave the following positive signs that could indicate the end of the decline.
All of the above criteria occurred and the stock market rose sharply. The S&P 500 (SPY) is overbought in the short term, not necessarily bearish. Now once again is another critical time for the market. The principles above are all viable guidelines to give further clues if the S&P 500 (SPY) will breakout to the upside or if a market top is forming.
Summing Up:
Our models are bullish, giving the all clear signal with above-average profit potential with risk well below average.
For the very short term, a break above 204.00 on the S&P 500 (SPY) will get the bulls interested again and a break below 200.00 may bring out the sellers. I recommend having an exit plan in case the bears come out of hiding and the S&P falls below 195.00. Watch to see if the S&P 500 (SPY) goes through resistance between 212.00 and 214.00, giving a higher objective to 228.00. The odds favor the bulls!
I welcome you to call to share your comments, feedback or questions at 516.829.6444 or email bgortler@signalert.com.
*******Article in Systems and Forecasts March 17, 2016


Create more wealth in your life
with these simple strategies.
As an added bonus you will also
receive BG’s Updates and Ezine

Discover how to quickly create more well-being in your life with these simple strategies.
As an added bonus you will also
receive BG’s Updates and Ezine

As an added bonus you will receive BG’s Updates and Ezine

All work listed on BonnieGortler.com is licensed under a Creative Commons Attribution - Noncommercial - No Derivative Works 3.0 Unported License.
