

Bonnie’s Market Update 4/12/24
04/14/2024
The S&P 500 Index, NASDAQ Composite, and Russell 2000 Index all closed below their January 20th lows on February 11th. However, instead of the indices accelerating lower and following through to the downside, prices stabilized and moved sharply higher with three strong days, the longest streak since August 2015. Global stocks were likewise having a rough month in February and rebounded also. Despite the recent rise demonstrated by many individual country ETFs, many overseas markets remain down over 20.00% for the year, in bear market territory. The continued high volatility worldwide is worrisome. The downtrend remains in effect and I expect further wide swings intraday and more volatilityto continue.
Major indices are below their 200-day moving averages. There have been many intraday swings greater than 5% in the Energy, Biotechnology and Banking sectors in February. Even though the market has rallied for a few days, as investors have bought stocks that have fallen sharply, the trend remains down.
The tape action has not confirmed that a market bottom is in place and our trading models are still negative, signifying high risk. With the January lows not holding, intermediate charts showing weakening momentum conditions, and longer term charts mostly in down trends, the market remains risky and another test of the lows is likely.
What Are The Charts Saying?
QQQ (Nasdaq 100 Index) Weekly Price and Trend Channels (Top), and MACD (Bottom)
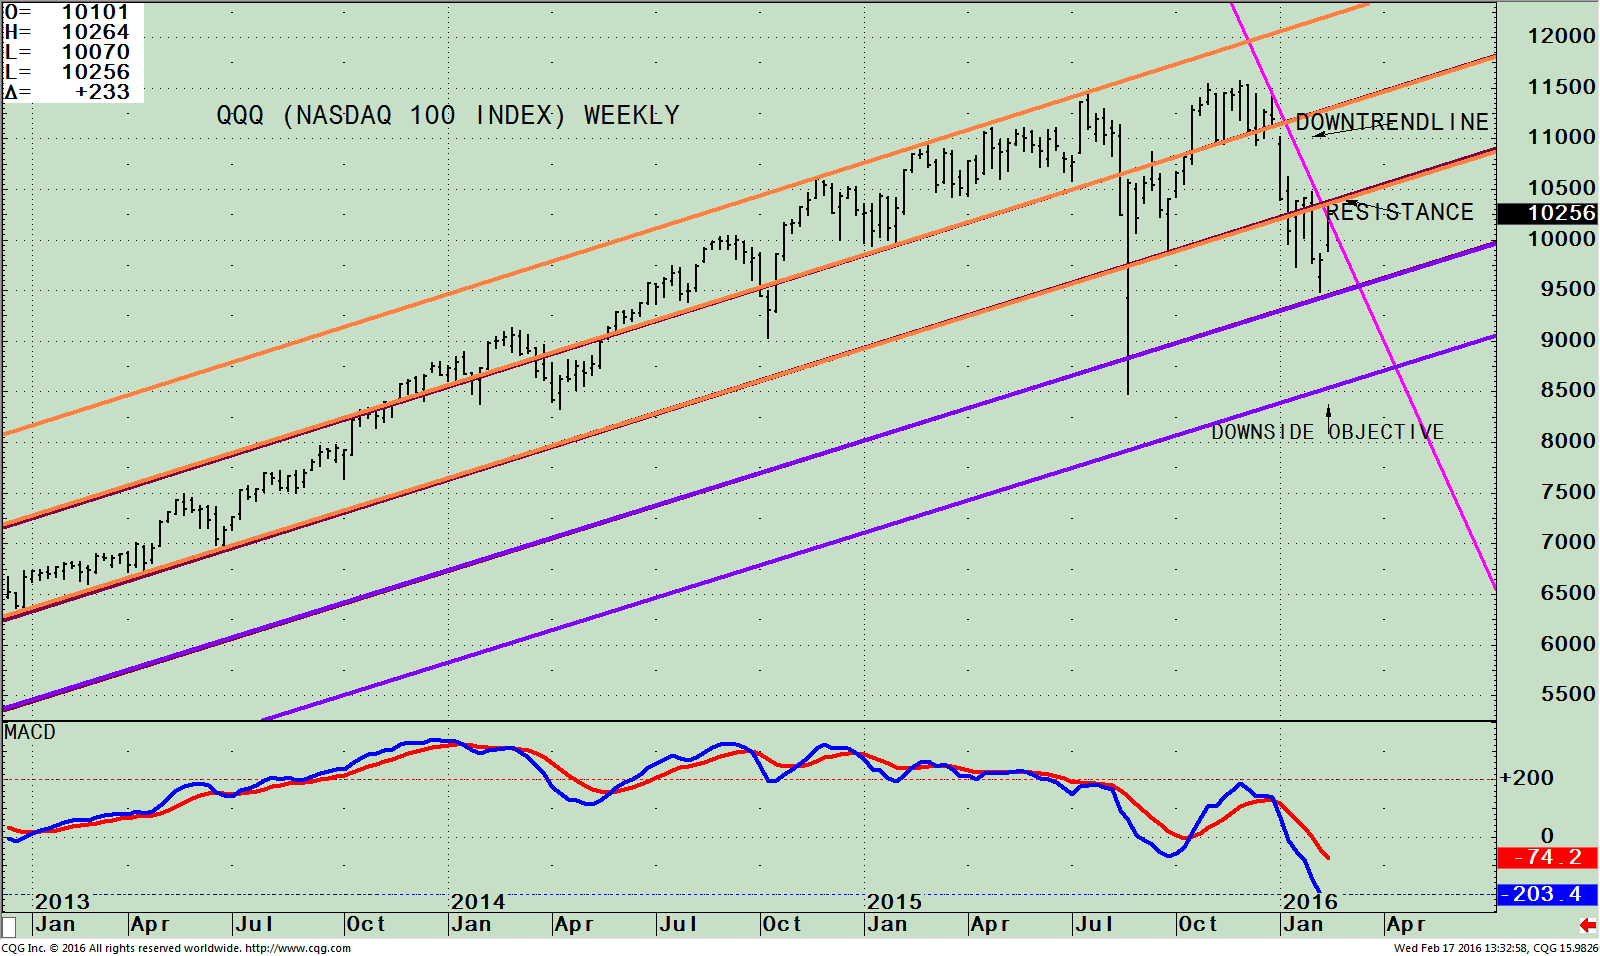
The top part of the chart above is the weekly QQQ, an exchange traded fund (ETF) representing the Nasdaq 100 Index, with the price and trend channels that are acting as support and resistance areas. QQQ includes 100 of the largest domestic and international nonfinancial companies listed on the Nasdaq Stock market based on market capitalization. As of 02/16/16, Apple, (AAPL) is the largest holding comprising 11.35%, Microsoft Corp (MSFT) 8.46%, Amazon.com, Inc.5.77%, Alphabet Inc. Class C 4.96% and Facebook, Inc. Class A 4.48%. The QQQ is generally more speculative and riskier than the SPY. Historically when the QQQ is strong it’s a bullish condition for the entire market.
QQQ failed to break out to the upside like other major averages in late 2015. A decline followed the first week of January that formed a downtrend, a negative pattern of lower highs and lower lows, trading within the channel (orange lines) from January 2013, except for the one day blip that occurred in August 2015. The February low in the QQQ stopped at the supporting channel (purple line) and has turned up.
The QQQ as of 2/17/16 closed just below resistance above in the 104-105 area. If the QQQ fails to get through resistance or turns down from below 95, the downside channel objective to 85.00.
The lower portion of the chart is MACD, a momentum indicator. At this time MACD is in an oversold condition as the decline has been significant. There has been no turn up or positive divergence in place.
More time is needed for favorable patterns to develop. A safer entry would be in 3-6 weeks.
Weekly QQQ) / (SPY) Ratio (Top); MACD of QQQ/SPY Ratio (Bottom)
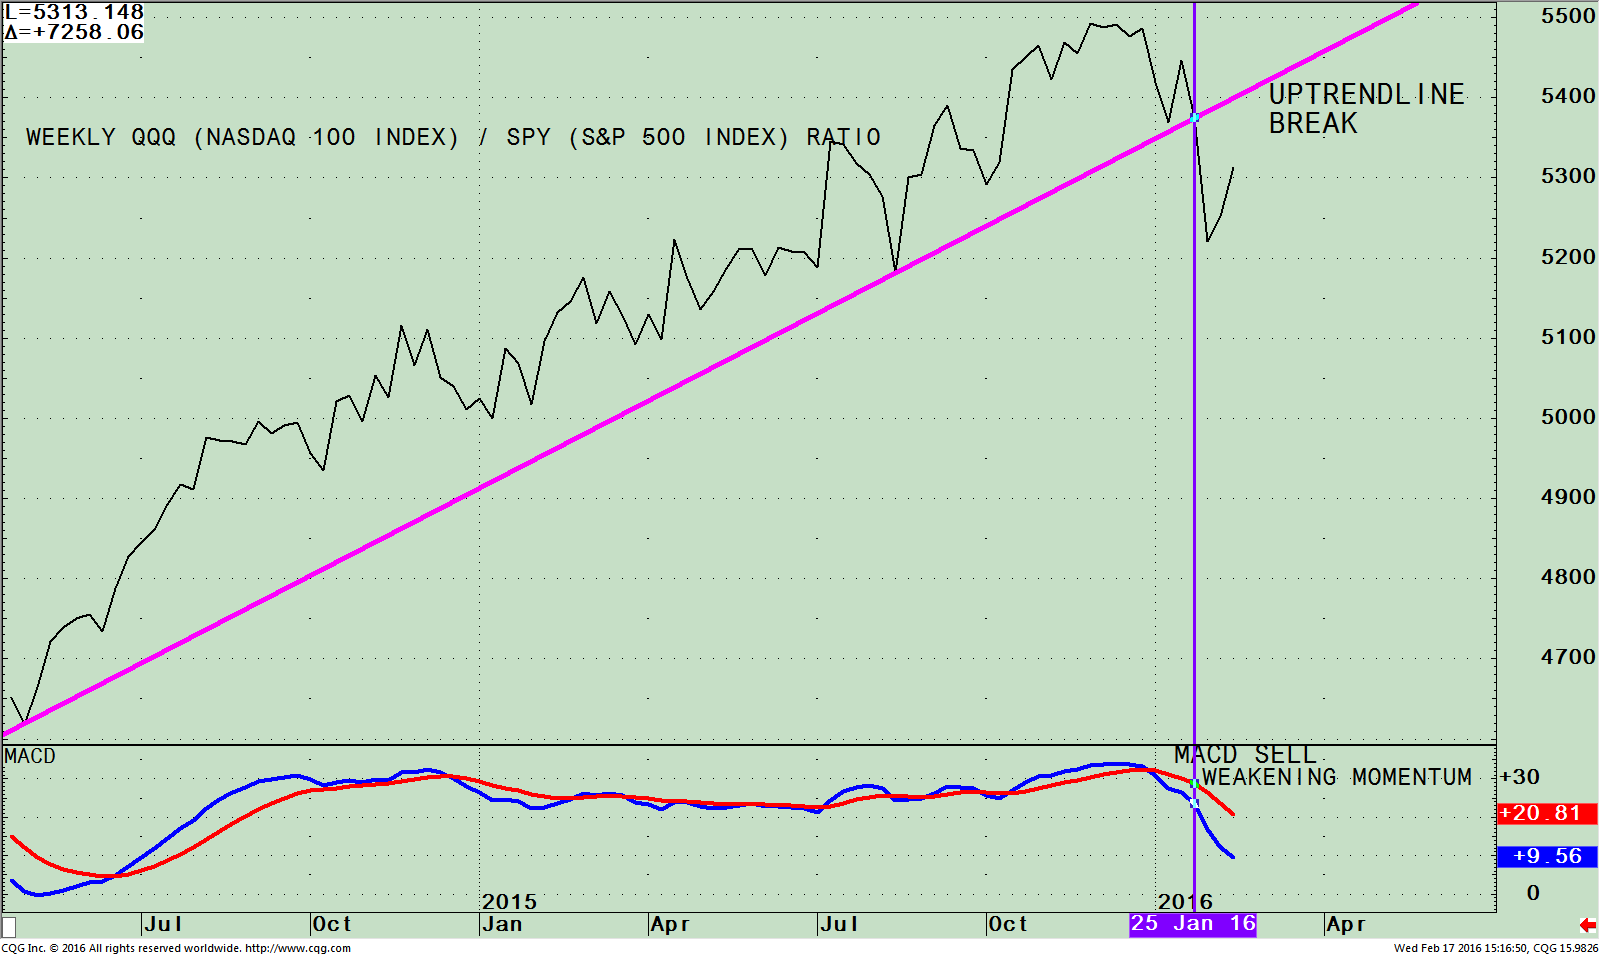
The top part of the chart is the weekly QQQ (Nasdaq 100 Index /SPY (S&P 500 Index) ratio (QQQ/SPY). A rising line means the QQQ is stronger, and if falling, the S&P 500 is stronger. The QQQ/SPY ratio peaked in late November 2015, went sideways for a few weeks and then started to fall breaking the uptrend from May 2014 (Pink Line). Early in February the ratio turned up again. It’s still below the trendline break and no bottom formation has formed.
It’s possible the rise from 02/12/16 – 02/17/16 is nothing more than a short term advance that will fizzle sooner rather than later.
The lower portion of the chart is MACD, a momentum indicator that has also generated a sell. Thepattern is clearly showing weakening momentum, at the same time the QQQ/SPY relative strength ratio broke its upside trend line (vertical line in purple). Until more favorable patterns form, either a double bottom in the ratio or a double bottom in MACD, the present reflex rally most likely will end and the ratio
will move lower. For those of you who have large holdings in technology, now might be a good time to reduce positions in the technology sector and move to SPY or raise cash.
Monthly QQQ) / (SPY) Ratio (Top); RSI of QQQ/SPY Ratio (Bottom)
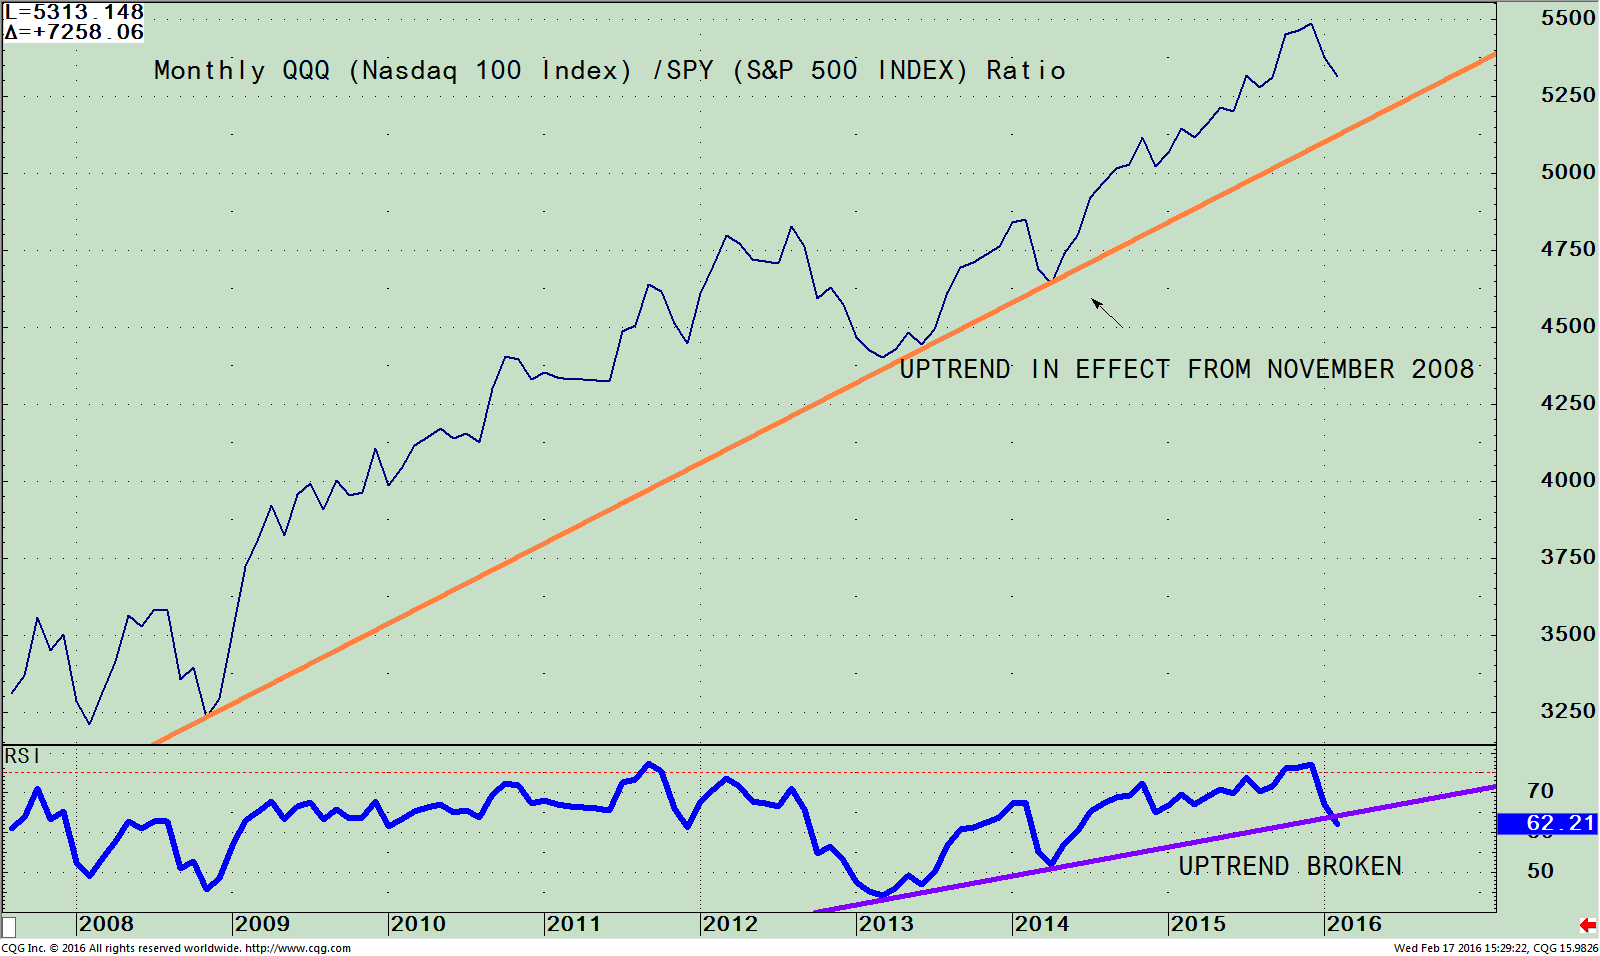
The top part of the chart is the monthly Nasdaq 100 /S&P 500 ratio (QQQ/SPY ratio). A rising line means the QQQ is stronger, and if falling, the S&P 500 is stronger. As of 2/17/16 the ratio has turned down however, the uptrend trend from 2008 is intact. If the uptrend of the (QQQ/SPY) ratio from November 2008 (orange line) is violated, this would not be positive for the overall market.
The lower portion of the chart is the monthly relative strength of the (QQQ/SPY) ratio. The uptrend line (purple line) has now been broken for the first time since 2013 giving a warning signal that the Nasdaq 100 (QQQ) is losing strength to the S&P 500 (SPY). This development in addition to the Biotechnology long term uptrend being violated (as discussed in the 02/04/16 article in Systems and Forecasts) is another sign investors are moving their money away from the technology sector. Keep a close eye if the QQQ under performs the S&P 500 (SPY) over the next few weeks. If the condition continues, this would not be a healthy sign for the stock market going forward. It will be more important to be very selective in what stocks you own. Equity holdings that are more consistent having low volatility will be a better investment if the market stalls and a serious decline occurs.
Summing Up:
Some stocks were at bargain prices after being beaten up, so investors stepped in to buy and the market staged a 3 day advance. The Nasdaq 100 (QQQ) compared to the S&P 500 (SPY) relative ratio momentum patterns for the intermediate and long term is no longer supporting stocks which are worrisome. The QQQ/SPY RSI weekly ratio has broken the uptrend from May 2014, another warning signal to be careful in this market. The long term trend is also in jeopardy. The RSI of QQQ/SPY has broken its long term relative strength ratio uptrend from 2013. If the Nasdaq 100 continues to be weaker than the S&P 500 (SPY) then it could break its long term uptrend from 2008 ending the bull market run.
It’s not unusual for the market to rally sharply in a downtrend when investors think a bottom has occurred. A few days of higher prices back to back doesn’t constitute a market bottom. Our models remain negative, suggesting risk remains high. For now I recommend treading lightly and reducing holdings in Nasdaq stocks looking for a safer opportunity in 3-6 weeks.
I welcome you to call me with any comments, feedback or questions at 516.829.6444 or email bgortler@signalert.com.
*******Article in Systems and Forecasts February 18, 2016


Create more wealth in your life
with these simple strategies.
As an added bonus you will also
receive BG’s Updates and Ezine

Discover how to quickly create more well-being in your life with these simple strategies.
As an added bonus you will also
receive BG’s Updates and Ezine

As an added bonus you will receive BG’s Updates and Ezine

All work listed on BonnieGortler.com is licensed under a Creative Commons Attribution - Noncommercial - No Derivative Works 3.0 Unported License.
