

5 Investing Strategies to Save Money and Grow Wealth
04/11/2024
For the first five months of 2015 the S&P 500 (SPY) traded within a tight trading range that resolved to the downside in May, not amounting to much, and short lived. No real follow-through to the upside occurred, and then a 13.4% decline occurred in August. Healthy pullbacks along the way occurred as the market consolidated its gains.
The wall of worry remains. Sharp, quick trading swings up and down would keep one up at night, leaving one on pins and needles wondering if and when a major correction would occur.
So far none has happened and all is well.
Since the last newsletter on 11/12/15, the S&P 500 (SPY) left some clues indicating a further rally, showing its best week since October 2014, gaining over 3%. The odds favor the bulls over the next several weeks, with favorable seasonality upon us now, but the tape action needs to improve for the rally to be sustained into the New Year.
It’s been a challenge to be profitable. Few stocks are making new highs, and many stocks are down more than 10% for the year. There is room to the upside for the S&P 500 (SPY) along with other major averages if the rally could broaden in scope and penetrate the overhead resistance. With favorable seasonality here, I am optimistic that resistance will be broken soon.
Let’s Review the Tape Action of the 10 Clues for Further Guidance
New 52-week lows on the New York Stock Exchange were mostly above 100 in recent trading sessions. On 11/24/15 the reading was 67, the lowest since 11/05/15. I would like to see new 52-week lows under 50. It would be even better if the new 52-week lows could fall and stay below 25.
An optimistic sign is that the 10 Day Ratio of NH / (NH+NL) on the NYSE has turned up from an oversold condition, with a bullish double bottom formation in place.
Market breadth on the New York Stock Exchange continues to be disturbing even with last week’s advance. A consistent reading of more than 500 advances is still needed and would be a good sign of further gains ahead for a broader sustainable rally.The CBOE Volatility Index (VIX) (a measurement of fear) has gone below 19.00. The VIX as of 11/25/15 intraday is at 15.40. This is a good sign.
During the recent advance there was not a trading session when there was 9 to 1 more upside than downside volume on the New York Stock Exchange. On 11/16/15 the reading was close with 8.66:1.
Overseas markets appear stable but are not gaining in relative strength compared to the U.S.equity’s. Emerging Markets (EEM) as a benchmark remain above 33, but so far has not gone through the key level above 36.00. (On 11/25/15 intraday the EEM is at 34.67)
The Value Line Geometric Composite, an unweighted average of roughly 1700 U.S. stocks, remains below 473.00, the level that would imply another rally attempt will occur. (On 11/25/15 intraday the Value Line Geometric Composite was at 467.06).
More risky areas of the market are acting reasonably well. Healthcare (XLV), Biotechnology (XBI), Technology (QQQ), and Semiconductor stocks (SMH), are holding their ground well and look like they will move higher. No selling pressure in these areas is a plus for the overall market. Continue to observe if these sectors are stronger than the S&P 500 (SPY).
High yield funds and high yield ETF’s have been falling while U.S. equities were rising. The good news is December and January are historically good months for high yield bonds. I’m looking for more interest in this area from bond investors who are looking for yield. Continue to watch how the hi yield ETF’s (HYG) and (JNK) are doing intraday. They closed at 82.87 and 35.26 on 11/24/15.
A bullish signal of further advance ahead, is if the Russell 2000 (IWM) is stronger than the S&P 500 (SPY). In addition if the Russell 2000 (IWM) could get through resistance at 120.00, an upside objective to 130.00 is given. The intraday reading on 11/25/15 is 118.79.
What Do The Charts Say?
Daily (IWM)/ (SPY) Ratio (Top) MACD of IWM/SPY Ratio (Bottom)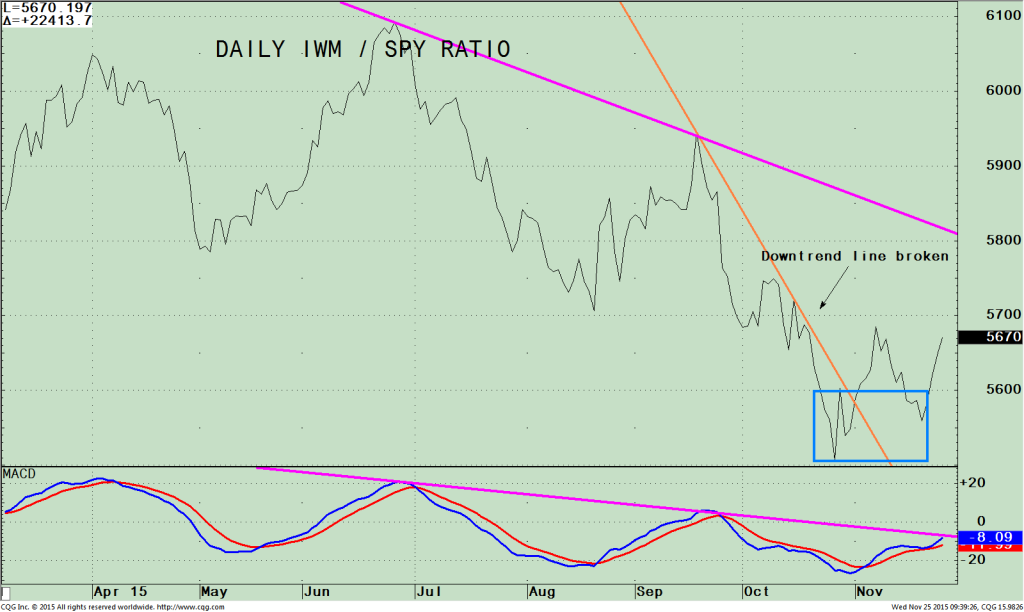
The top part of the chart on the right is the daily Russell 2000 /S&P 500 ratio (IWM/SPY ratio). A rising line means the IWM is stronger, and if falling, the S&P 500 is stronger.
As of 11/24/15 the ratio is rising. I am updating again because I feel it’s very significant for the small caps to participate for the rally to be sustainable. The Russell 2000 (IWM/SPY) ratio downtrend line was broken (orange line) to the upside.
Daily charts tend to give advanced notice of a potential trend change, however sometimes they are too early which was the case when a turn-up took place at the end of October. Once again, the ratio has turned up, but this time a bullish double bottom has developed. Another positive sign is the confirmation of the weekly ratio that has also turned up. (The chart is not shown).
The lower chart shows the MACD of the IWM/SPY ratio. A bullish rising double bottom is in place. The downtrend from June of 2015 (pink line) is close to being broken and could occur in a few days. The Weekly IWM/S&P ratio has also turned up, confirming the short term change in strength. As of 11/24/15 the IWM/SPY ratio is rising.
SPDR S&P 500 (SPY) Weekly with Operating Channels and MACD (Bottom)

The top part of the chart above is the weekly SPDR S&P 500 (SPY) showing the operating channels that are acting as support and resistance areas. A break through the resistance area, above 211.50 and 213.78 would give further upside of the S&P 500 (SPY), to the channel objective of 229-230 (the green line). If the market were to decline now instead of going up, the next support area is 197.00. If this support area doesn’t hold, a more serious decline toward the old lows would occur near the lower channel at 180.00 (pink line).
The lower portion of the chart is the technical indicator MACD, (a momentum indicator). MACD is below 0, in oversold territory and now on a buy. The downtrend (green line) remains in effect for now and potentially could take 3-4 weeks of strength in the S&P 500 to be violated to the upside.
Summing Up:
The market has stabilized, as it rides along a wall of worry. U.S. equities are still digesting last week’s gains while investors position their portfolios for the final weeks of the 2015.
The market is not out of the woods yet, with market risk higher than I would like. Our equity models remain overall neutral, but if stocks continue to rise, the models would uptick to neutral-positive.
I am optimistic since we are in a time of the year that is historically very favorable for stocks. Tape action is starting to improve. Small caps are showing some signs of leadership over the S&P 500.
Many market indices are still below their overhead resistance, but could change soon. Follow the tape action that will give you clues to the strength of the advance. Watch the price levels of the S&P 500 (SPY) and the Russell 2000 (IWM) to see if investors are more interested in buying for a potential year-end rally. A break through 211.50 and 213.78 on the S&P 500 (SPY) would give further upside to the channel objective of 229-230 and if the Russell 2000 (IWM) could get through resistance at 120.00, an upside objective to 130.00 is given.
I wish you and your family a very happy Thanksgiving and a healthy wealthy happy holiday season.
It’s almost the end of the year. Need a second pair of eyes to take a look at your portfolio? Please feel free to call me at 1-844-829-6229 or email me at bgortler@signalert.com. I’d be happy to help.
*******Article in Systems and Forecasts November 25, 2015
This is a hypothetical result and is not meant to represent the actual performance of any particular investment. Future results cannot be guaranteed. Although the information is made with a sincere effort for accuracy, it is not guaranteed either in any form that the above information is a statement of fact, of opinion, or the result of following any of the recommendations made herein. Readers are encouraged to meet with their own advisors to consider the suitability of investments discussed above for their own particular situations and for determination of their own risk levels.


Create more wealth in your life
with these simple strategies.
As an added bonus you will also
receive BG’s Updates and Ezine

Discover how to quickly create more well-being in your life with these simple strategies.
As an added bonus you will also
receive BG’s Updates and Ezine

As an added bonus you will receive BG’s Updates and Ezine

All work listed on BonnieGortler.com is licensed under a Creative Commons Attribution - Noncommercial - No Derivative Works 3.0 Unported License.
