

5 Investing Strategies to Save Money and Grow Wealth
04/11/2024
State of the market: The prospect of a December interest rate hike has increased, with the latest release of the employment numbers on 11/06/15. The unemployment rate fell to 5%, its lowest level since April 2008. This report has sparked some selling pressure in the bond sector. In addition, traders are processing the latest round of earnings and beginning to think about what is needed to rebalance their portfolios at year-end. All of these factors have caused a change in investor psychology as to where to invest and what to look for over the next few weeks.
The likelihood of a rate hike in December led to higher yields and profit-taking in stocks that pay higher dividends than the S&P 500 Index (2%). Investors took profits in stocks that pay higher dividends. Utilities (XLU) Real estate (IYR) and Consumer Staples (XLP) lagged the S&P 500 (SPY). Utilities (XLU) failed to get through their August highs, stopping at weekly resistance and not breaking the downtrend. With interest rates expected to rise sooner rather than later, it’s best not to have a large amount of capital allocated to these sectors until they stabilize. As rates rise, more selling pressure is likely in bonds.
The talk of a rate rise helped the financial sector, especially the banks, and the U.S. dollar, which is now close to highs made in April 2015. The rise in the dollar was bad news for Gold (GDX), Gold Miners (XME), and other commodity related stocks which fell sharply, and again are now near their lows. Emerging Markets (EEM) also has been weak so far in November, having given back some of the October gains. EEM failed to get through resistance at 37.00 as discussed by Marvin Appel in the 10/30/15 newsletter. However, (EEM) is not yet at the ideal bottom-fishing level of 31.50 for swing trading or covered call writing.
U.S. stocks have stalled as the Fed signals the likelihood of a rate hike in December. Time was needed to work off the near-term overbought condition that we have had since the large gains in October. Yet there has been no significant sell-off to speak of. My interpretation is that the pullback that has occurred so far has been healthy, with the market consolidating its recent gains.
I am looking for this consolidation period to end sooner rather than later. Our intermediate-term models remain neutral-positive. No changes have taken place as of yet to give an all-clear signal indicating that risk would be contained if a decline instead of a year-end rally were to occur. If market breadth improves along with small caps gaining strength over the S&P 500, the remainder of the year could signal further gains ahead.
SPDR S&P 500 (SPY) Monthly with Andrews Pitchfork ETF (Top) and MACD (Bottom)
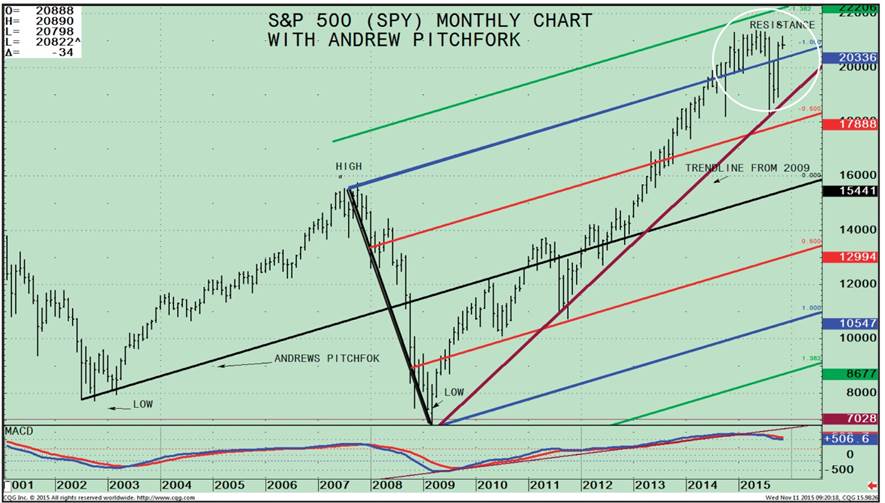
The top portion of the above chart is the monthly ETF S&P 500 (SPY) using an Andrew’s Pitchfork to show a low-high-low point configuration that I have connected with an upward trendline.
The pitchfork developed by Alan Andrews is one of my favorite charting tools. I have used it for over 30 years to help identify major trading channels. You can find the Andrews Pitchfork on most charting software packages, and it is easy to use. It requires three points, each marking an important pivot. You can use the Andrews Pitchfork on charts of any time period, adjusting it to your needs to help identify significant channels.
There is more room to the upside with the upper channel at 220, but first the S&P 500 (SPY) needs to penetrate resistance at 211.50, the high made on 11/4/15, followed by 213.78, the old high from June 2015.
If investors decide to focus on rising interest rates, or investors decide to lock in some profits for the year before option expiration, a short term pullback or sideways action is possible, and would still be considered healthy after October’s large gains.
Support is at the 2015 October lows of 186.00.
As long as the up-trend line holds, I expect higher prices going forward. Favorable seasonality starts in November, which is historically a strong month, so I am not expecting a severe pullback at this time. The lower portion of the chart is MACD; a momentum indicator.
MACD is not in the best condition after breaking the uptrend from 2009 and presently trading above 0. MACD will take months before the S&P 500 (SPY) resets and goes below 0 and a low risk buy could develop for the long term. The good news is MACD has no negative divergence in place, with MACD making a high along with the S&P 500 (SPY). Momentum is waning, but after many years of rising, this is normal. Keep an eye out to see if the S&P 500 (SPY) does takes out the high and if MACD doesn’t, forming a double top with a negative divergence. If this happens it would be bearish.
Summing Up
The long term uptrend is intact. S&P 500 has had a big run to the upside from the October lows, and is now trading in an area of overhead resistance.
Some profit-taking has transpired in recent trading sessions, as the S&P 500 (SPY) was short-term overbought after October’s big rally.
More backing and filling could occur, but no serious decline is expected with favorable seasonal tendencies upon us.
As long as the S&P 500 (SPY) remains above the up trendline the bulls will remain in control. Watch to see if the SPY can break through resistance above 211.50, followed by 213.78 with an objective to 220.00.
I would love to hear from you! Please feel free to share your thoughts, ask your questions or share your comments with me. Call 1-844-829-6229 or email me at bgortler@signalert.com.
*******Article in Systems and Forecasts November 12, 2015
This is a hypothetical result and is not meant to represent the actual performance of any particular investment. Future results cannot be guaranteed. Although the information is made with a sincere effort for accuracy, it is not guaranteed either in any form that the above information is a statement of fact, of opinion, or the result of following any of the recommendations made herein. Readers are encouraged to meet with their own advisors to consider the suitability of investments discussed above for their own particular situations and for determination of their own risk levels.


Create more wealth in your life
with these simple strategies.
As an added bonus you will also
receive BG’s Updates and Ezine

Discover how to quickly create more well-being in your life with these simple strategies.
As an added bonus you will also
receive BG’s Updates and Ezine

As an added bonus you will receive BG’s Updates and Ezine

All work listed on BonnieGortler.com is licensed under a Creative Commons Attribution - Noncommercial - No Derivative Works 3.0 Unported License.
