

5 Investing Strategies to Save Money and Grow Wealth
04/11/2024
What a difference a few weeks makes. The stock market character changes quickly week-to-week. Your perception and expectations need to change as well. Caution has given way to a more optimistic view as we’ve seen the market internals improve.
Two weeks ago, the worst quarter for the stock market since 2011 ended. The August lows were tested. More evidence of a bottom was needed (see the 10/02/15 newsletter) or a serious decline seemed very possible. After the third quarter ended, buyers stepped in aggressively to the S&P 500 SPDR (SPY) and other major averages. Equities stopped falling, a broad-market rally developed in the U.S., and global markets successfully tested the August lows.
Let’s review what has occurred since the last newsletter (10/02/15). An oversold condition in the market occurred after heavy selling in September. Stocks then rallied sharply, having one of the best weeks of the year in the beginning of October. This created a very overbought condition.
During the past two days the market has pulled back, alleviating the overbought condition. This is normal after such a large rally, but now it’s important that the market stabilizes and goes higher from here to confirm the bottom is in and a fourth quarter rally could occur.
Tape Action Gave Evidence That The Bottom Is In For Now
During the test of the lows in early October, the iShares Russell 2000 Index ETF (IWM) made a new low on 09/28/15 at 106.99, but held above 105.00 which was support. The S&P 500 (SPY) didn’t make a new low as did the Russell 2000 (IWM), holding support at 184.00.
Advancing volume on the New York Stock Exchange did increase on days when the market rose.
On 10/05/15, there was 15 to 1 upside to downside volume on the New York Stock Exchange, alleviating the downside pressure on the market.
New 52-week lows fell to below 50 on the New York Stock Exchange on 10/05/15. This is still the case as of this writing.
Momentum patterns did improve on MACD while testing the lows. Some indices such as the Russell 2000 (IWM) actually penetrated the August lows forming a positive divergence, (a new low in price was made but MACD did not). This is a bullish condition.
Overseas markets have firmed, acting much better. Many international ETF’s are up more in October than the 4.39% gain in SPY, for example Brazil (EWZ) +7.8%, Emerging Markets (EEM) +9.52% and China (FXI) +10.52% through 10/15/15.
The CBOE Volatility Index (VIX) contracted from 28.33 to 16.34, falling 42.3% over nine consecutive
days. The big decline in VIX reflects falling risk aversion among options traders.
High yield mutual funds are no longer acting poorly, helped by strength in energy. Many high yield
funds gained over 2% from their lows made in early October, a positive sign for the overall market. High Yield ETF’s (HYG and JNK) are both up over 4% since September 28. Closed-end high yield funds that were trading at large discounts also rallied strongly, gaining over 6%. The Value Line Geometric Composite, an average of roughly 1700 U.S. stocks, did stabilize after falling to 429.34 rallying above 452.00, and now is trading higher at 465.62.
What is troublesome since the test of the August lows?
As the market was testing the lows, the financials (XLF) hasn’t shown leadership as yet. Watch for the financials to be stronger than the S&P 500 by following the (XLF/SPY) relative strength ratio to see if it starts to rise sharply. If so, this would be bullish.
Healthcare (XLV) and Biotechnology (XBI) were sluggish when the market rallied from the lows. A good sign would be if they turn up and lead the market higher.
Small Caps are lagging the S&P 500 (SPY instead of being stronger and leading the market higher. If The Russell 2000 (IWM) could begin to outperforming the S&P 500 this would be a very encouraging sign that the rally could broaden. Further strength could occur ahead with more stocks participating in the rally.
The long term trend remains unfavorable after breaking up trends from 2009. There has been no major decline to create an oversold condition. Also, with the recent rally prices remain below overhead resistance. If a fourth quarter rally does occur and new highs are not made in the averages, potential bearish patterns with a double top could form.
Our models have improved, but have not generated a signal that the market is out of the woods yet.
Risk remains above average.
What Do The Charts Say?
Ishares Russell 2000 ETF (IWM) Weekly Price (Top), and MACD (Bottom)
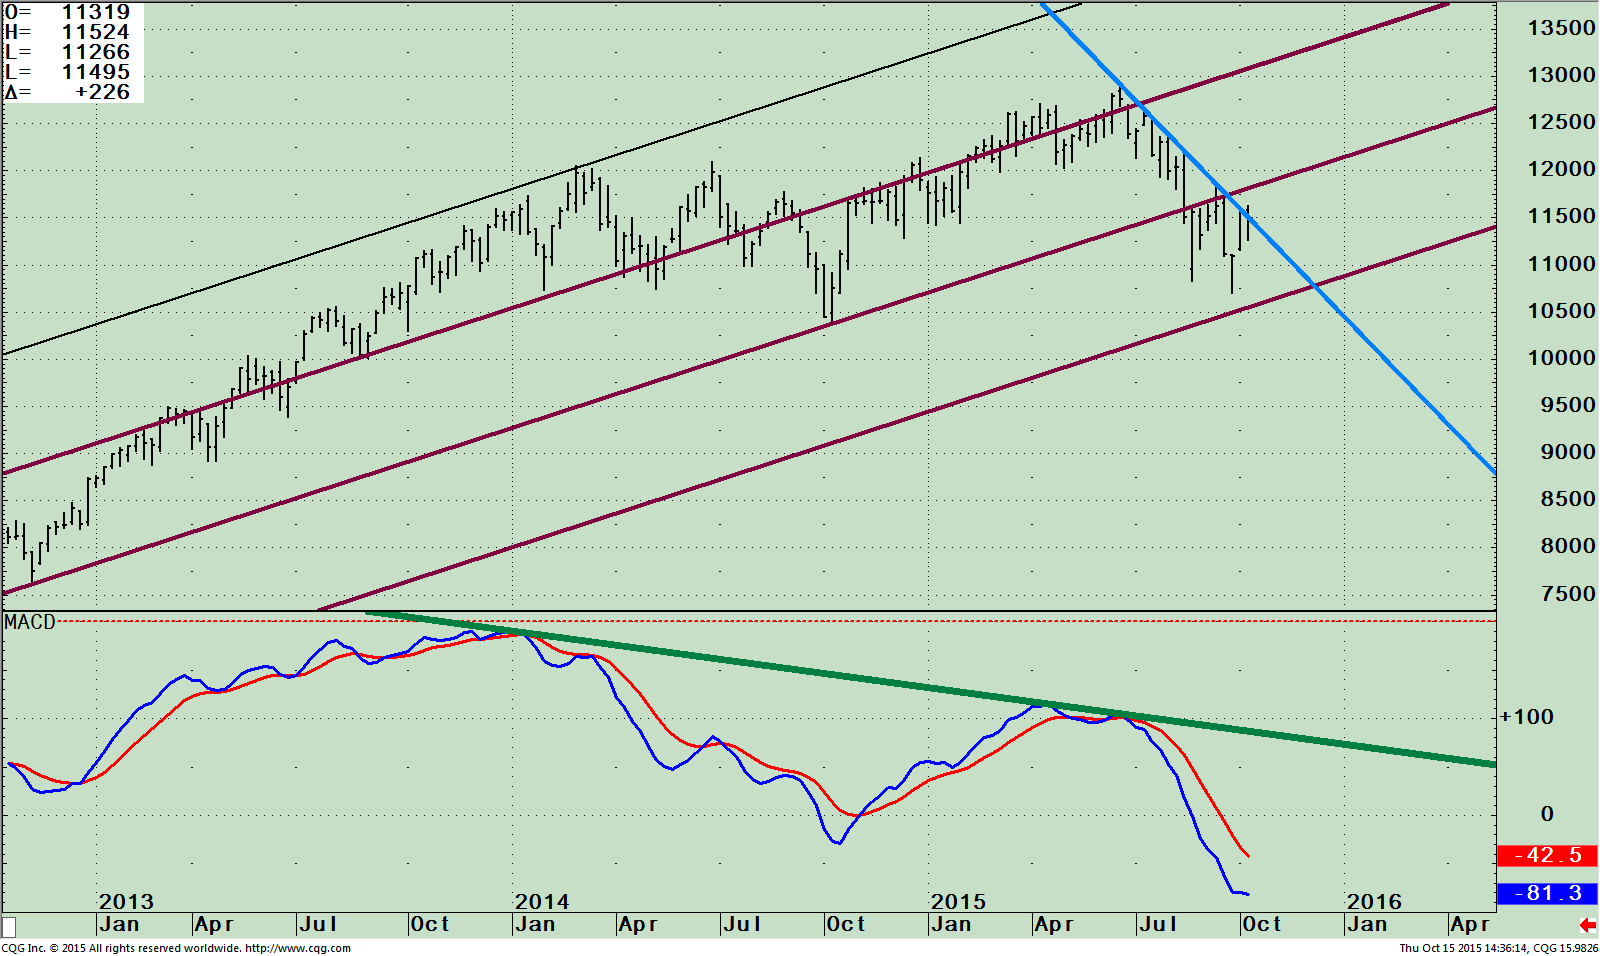 The top portion of the chart shows the weekly Ishares Russell 2000 ETF (IWM) which is made of companies with a market capitalization of between $300 million and $2 billion. Historically this is a favorable time of the year for small caps to rally, and the good news is the chart patterns are in position where it could be significant.
IWM peaked on 06/22/15 at 129.10 but the S&P 500 (SPY) continued higher into August. IWM has stayed within a trading channel for the past 8 weeks (top portion of the chart) but looks to me like it could be ready for a breakout to the upside. There has been no real sign of strength as of yet, but this could change very quickly. Present trading action is close to breaking the weekly downtrend (blue line) which is the first step. Next, it would be more bullish if the IWM could get above resistance at 120.00. This would give an upside objective to 130.00.
If the rally were going to fail then IWM would stall now and turn down below 109.00, suggesting another test of the lows (106.99) would take place and potentially a more serious decline could arise
if 105.00 is violated.
The lower portion of the chart is the technical indicator MACD, (a momentum indicator). With investors being more defensive, small caps have been weaker than the S&P 500. Momentum has been negative since December 2013 (green line). IWM remains far away from breaking the downside trend in momentum but I remain optimistic. MACD is oversold, no longer accelerating down, and in position and for a turn up soon if the IWM stabilizes.
iShares Russell 2000 ETF (IWM) Daily Price (Top), with a 50-Day Moving Average and
MACD (Bottom)
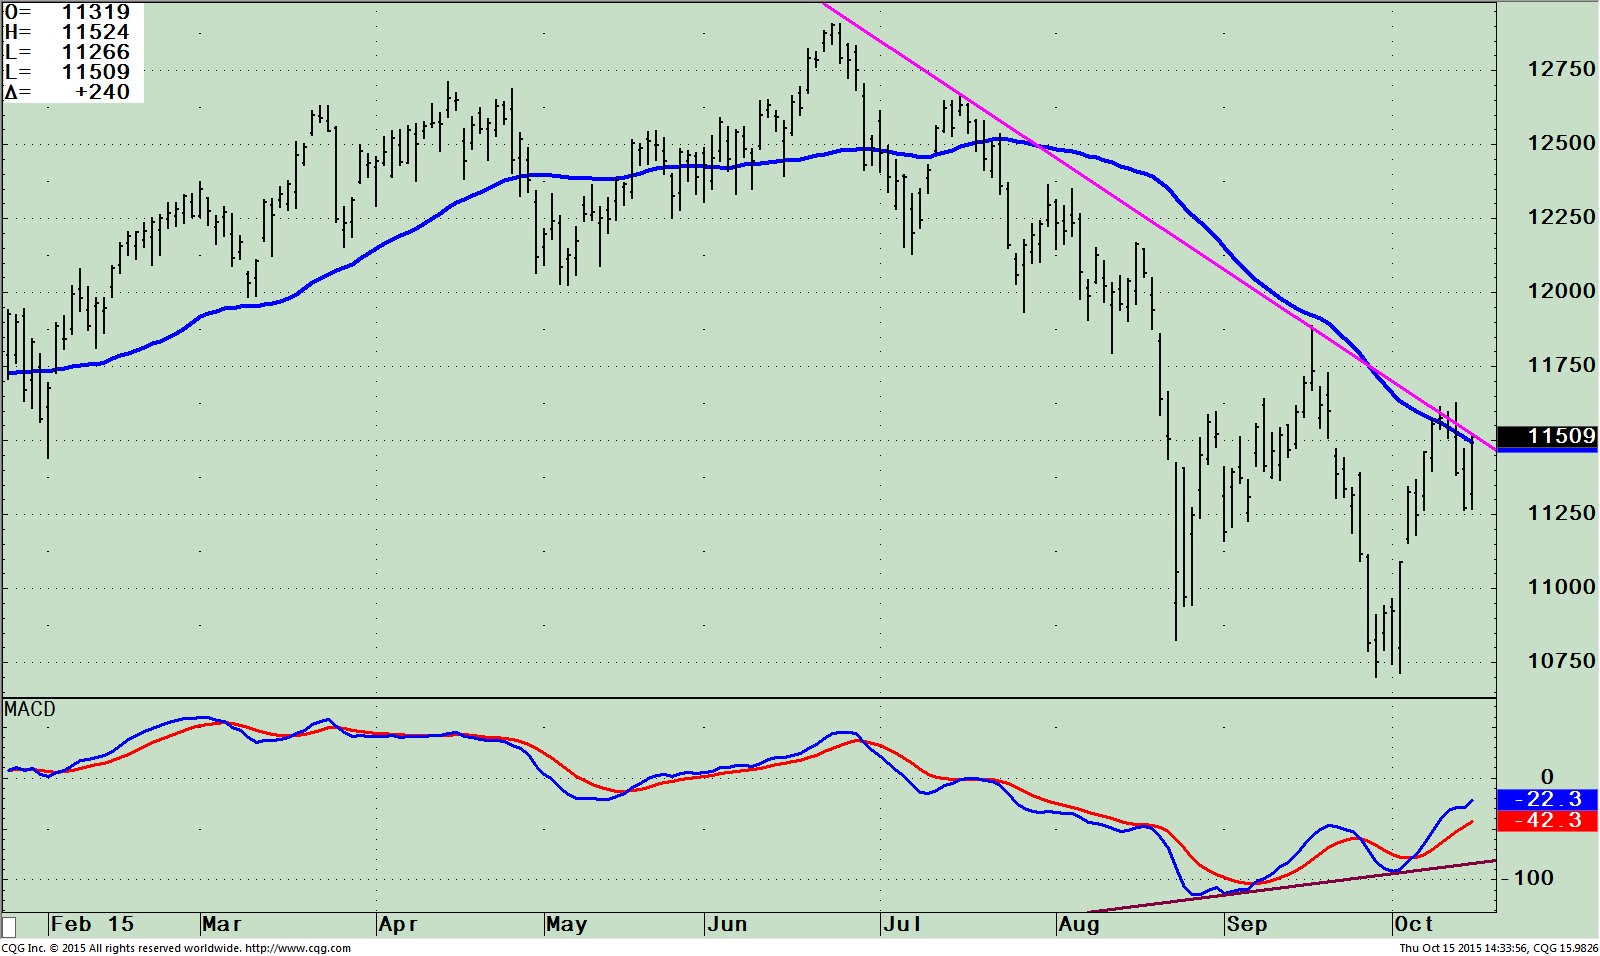
The daily trend is down (see the pink line) as of October 15th, but very close to turning up. At the same time, IWM is in position to break above its 50 day Moving Average at 115.11. (As I write this article IWM its 115.09). After testing the lows, IWM failed the first time to get through the 50-day Moving average. The rally paused for two days and now IWM is rising once again. MACD has a rising double bottom in place with along with a positive divergence in place. This is a very bullish pattern.
Just To Sum Up:
The market internals have improved significantly since the start of October. Tape action gave evidence the bottom is in for now. Daily and intermediate trends are turning more favorable. A few troublesome items remain but overall the tape action is much improved. I am recommending watching the Russell 2000 (IWM), to see if favorable seasonality for small caps will begin and lead the market higher breaking through 120.00. If this is another rally that will fail, then the Russell 2000 (IWM) would stall now and turn down below 109.00. This suggests another test of the lows (106.99) would take place, and potentially a more serious decline could arise if 105 is violated.
I would love to hear from you! Please feel free to share your thoughts, ask your questions or
comments. Please call me at 1-844-829-6229 or email at bgortler@signalert.com.
*******Article in Systems and Forecasts October 16, 2015
This is a hypothetical result and is not meant to represent the actual performance of any particular investment. Future results cannot be guaranteed.
Although the information is made with a sincere effort for accuracy, it is not guaranteed either in any form that the above information is a statement of fact, of opinion, or the result of following any of the recommendations made herein. Readers are encouraged to meet with their own advisors to consider the suitability of investments discussed above for their own particular situations and for determination of their own risk levels.


Create more wealth in your life
with these simple strategies.
As an added bonus you will also
receive BG’s Updates and Ezine

Discover how to quickly create more well-being in your life with these simple strategies.
As an added bonus you will also
receive BG’s Updates and Ezine

As an added bonus you will receive BG’s Updates and Ezine

All work listed on BonnieGortler.com is licensed under a Creative Commons Attribution - Noncommercial - No Derivative Works 3.0 Unported License.
