

5 Investing Strategies to Save Money and Grow Wealth
04/11/2024
September was a very challenging month, completing the worst quarter since 2011. A broad decline in many sectors generated large losses, as the retest of the August 25 lows was and is still in process. There has been an increase in daily swings, and higher volatility than first six months of the year, when the S&P 500 (SPY) showed sideways action.
Those of you who chose to protect your money by reducing exposure and raising cash fared better than those that were bottom-fishing, buying too soon. Investing in internationals, financials, industrials, health care, energy or materials has been more stressful for investors. Biotechnology, (XBI) a sector that has been strong for years, fell over 24.5% in seven days. Defensive areas such as utilities and consumer staples were more stable, but these defensive areas might not remain stable if the broad market moves lower. Some indices have held above their August lows, while other averages lows have been violated.
On the last day of September the S&P 500 (SPY) rallied almost 2%, giving the appearance that a bottom has been made. It’s been five weeks since the August 25th low. The time constraint has been met for a potential bottom to occur. Since the long-term trend is down, I remain skeptical, and believe more base building is necessary, and more positive signs need to occur for a safe re-entry, making the risk is worth the reward.
Market Internals To Watch Now For Evidence Of A Market Bottom
Watch if there are more advances than declines for both the New York Stock Exchange (NYSE) and the Nasdaq Index on up days. In addition, if advancing volume is increasing on up days this would be a positive sign.
Look for one day’s trading where there is 9 to 1 more upside than downside trading volume on the New York Stock Exchange. If so, a rally could occur sooner rather than later.
Observe if the new lows shrink on the New York Stock Exchange to below 50. At the August low there were 1336, and September 29th there was 507 new lows, improving but still too high and dangerous.
Watch for favorable momentum patterns on your favorite sectors in indicators such as MACD. Even better would be if a positive divergence forms where there is a new low in price, with MACD making a higher high.
On the next rally if the financials are stronger than the S&P 500, watch the (XLF/SPY) relative strength ratio for when it starts to rise.
Overseas markets are weak. Look for overseas markets to firm and stop falling.
If the market were to have a big day down, look for a possible selling climax. This is where very heavy selling takes place and some investors give up, unable to stand the pain of the decline. Sometimes a few selling climaxes will take place before the ultimate bottom.
See if the CBOE Volatility Index (VIX) continues to shrink not rise, presently at 24.55. A rise above 29 would mean more intraday volatility and potentially more selling.
High yield mutual funds are acting poorly, some losing over 5% since 05/30/15. If high yields can turn up and stabilize, this would be a positive sign for the overall market. Exchange traded funds such as HYG and JNK could be monitored to see when and if they stop falling and start to rise. Also some high yield closed end funds remain under pressure with larger than normal discounts, but they have not stopped falling yet.
Small caps, Russell 2000, (IWM) need to hold above 105.00.
The Value Line Geometric Composite is an unweighted average of roughly 1700 U.S. stocks. It has clearly broken the monthly uptrendline from the lows of 2009, joining the other major averages, and MACD has generated a sell. The ability to stop falling, stabilize and penetrate 452.00 would make me more optimistic.
The S&P 500 (SPY) holds above the 08/25/2015 lows of 182.40, best case would be holding above 184.00.
What Do The Charts Say?
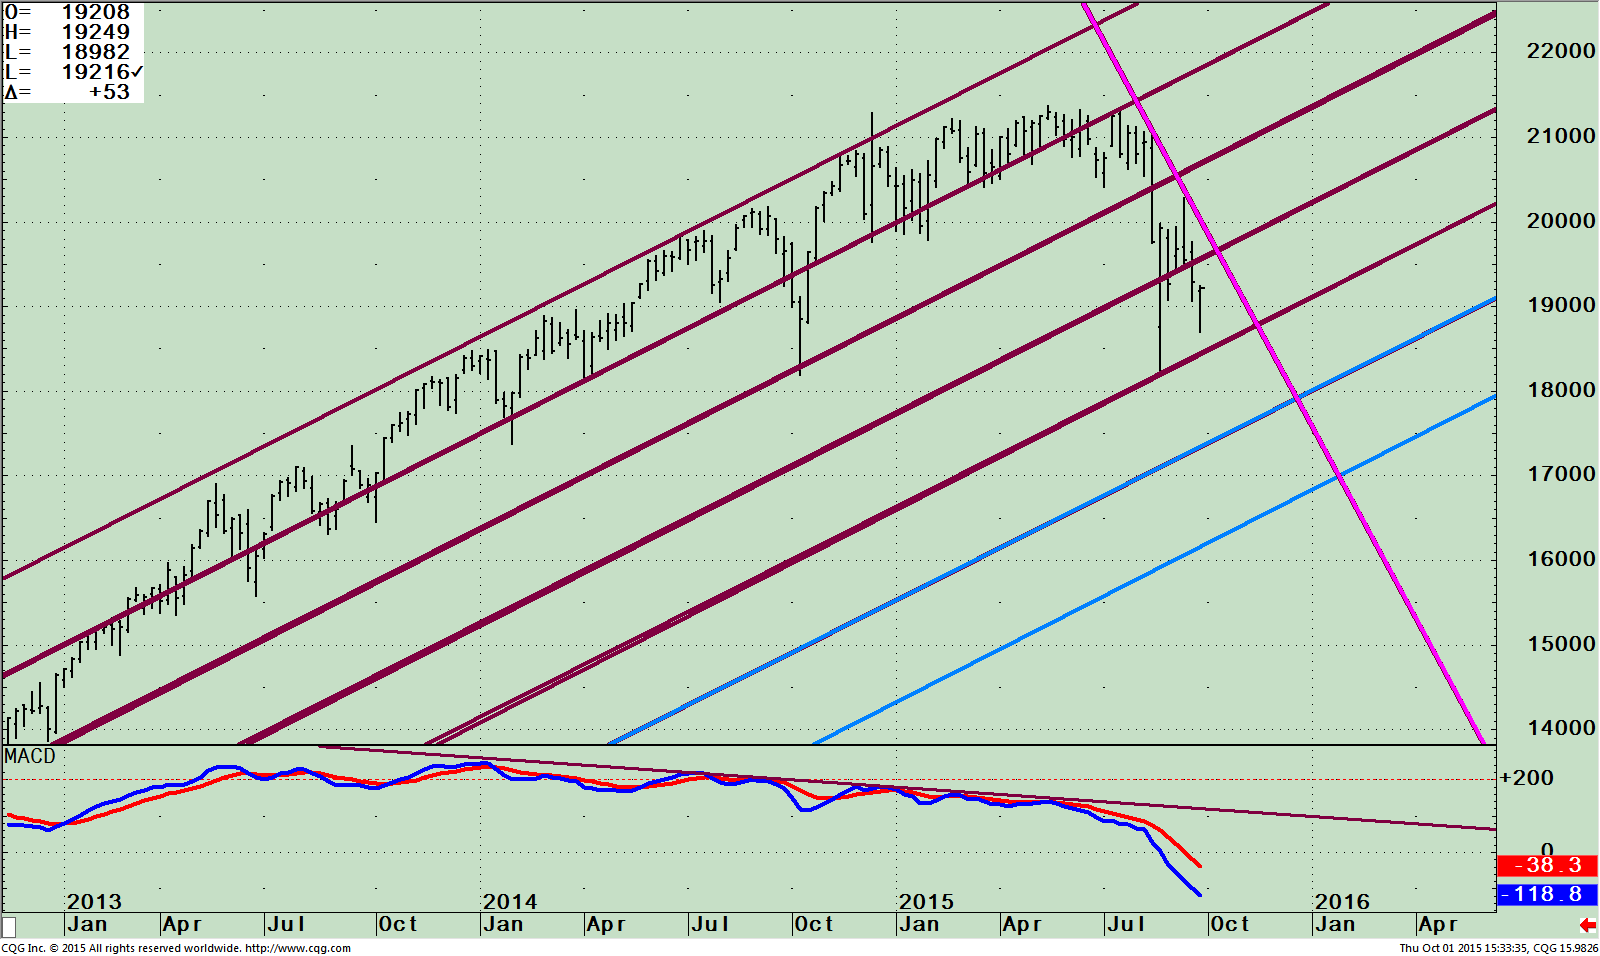
SPDR S&P 500 (SPY) Weekly ETF (Top) and MACD (Bottom)
The big question is will the August 25th low hold or if another leg down will take place?
More Evidence Needed For A Market Bottom
The top portion of the chart shows the weekly S&P 500 (SPY). I have drawn the operating channels that I am watching now to see where the market support and resistance lies.
After the low was made, the S&P 500 (SPY) had a short term rally for a few weeks that failed. A normal retest of the lows is 3-6 weeks. This has been satisfied. It’s been 5 weeks since the low of
182.40 with the S&P 500 (SPY) retracing to 186.93 on 09/29/15, holding above the 08/25/15 low. If indeed this has satisfied the re-test, the SPY would rise from here breaking the down trendline (see pink line) going through 200.00 followed by 207.50 where the next resistance area is.
If the market stalls, moves lower, and breaks below 184.00, the odds would increase that the 08/25/15 lows will be taken out. A more significant decline would follow to the first channel (blue line), of 172.00 followed by the complete channel objective of 162.00.
The lower portion of the chart is the technical indicator MACD, (a momentum indicator). MACD is oversold, below 0, in an area where significant rallies can develop. At this time there are no positive divergences or any turn up in MACD yet to suggest this is a safe buy now.
When a turn up materializes this would be favorable and suggest the worst could be over. For now new buying could be dangerous and caution is still recommended.
Just To Sum Up
Clearly the momentum in equities is down in both U.S. and globally. Remember prices fall faster than they rise. The evidence is not strong enough to say the re-test has been successful because there are too many pieces still missing for a real bottom in the market.
Short, intermediate and long term trends are down in too many averages to feel like a low risk market environment is in effect. I am recommending watching the Russell 2000 (IWM), to see if it holds above 105.00 and if the S&P can hold above 184.00. This, along with more confirmation from an improvement of market internals mentioned above, would be an incentive to think about buying.
The trend implies caution, have protective stops in place, and be patient for a safer opportunity to enter later this year.
I would love to hear from you! Please feel free to share your thoughts, ask your questions or comments. Please call me at 1-844-829-6229 or email at bgortler@signalert.com.
*******Article in Systems and Forecasts October 01, 2015
This is a hypothetical result and is not meant to represent the actual performance of any particular investment. Future results cannot be guaranteed.
Although the information is made with a sincere effort for accuracy, it is not guaranteed either in any form that the above information is a statement of fact, of opinion, or the result of following any of the recommendations made herein. Readers are encouraged to meet with their own advisors to consider the suitability of investments discussed above for their own particular situations and for determination of their own risk levels.


Create more wealth in your life
with these simple strategies.
As an added bonus you will also
receive BG’s Updates and Ezine

Discover how to quickly create more well-being in your life with these simple strategies.
As an added bonus you will also
receive BG’s Updates and Ezine

As an added bonus you will receive BG’s Updates and Ezine

All work listed on BonnieGortler.com is licensed under a Creative Commons Attribution - Noncommercial - No Derivative Works 3.0 Unported License.
