

Bonnie’s Market Update 4/12/24
04/14/2024
After many key market indices made lows in August, daily technical indicators moved into oversold position for the short term. Heavy selling by investors subsided in the first half of September. Investors were optimistic that the Fed would not raise rates this month, so a reflex rally occurred after the lows were made on 082415.
Instead of continued weakness, the market has been quite resilient after its sharp fall. A quick rally for a few days occurred, followed by a pullback that held well above the lows. This has triggered more buying, with many stocks trading near their lows of the year. Investors are still demonstrating a buy the dip mentality.
Even the latest rally doesn’t change the fact that the trend has changed from up to down, which means higher risk and more volatility going into the fourth quarter. It’s a good idea to take quicker profits, lower your profit expectations, and keep your stops close in case the market moves fast and goes against you. There is a good chance there will be a safer entry within a few weeks, a retest of the August 24 lows.
The intermediate and long term trend of the market has changed from positive to negative. The average intraday trading range of the S&P 500 (SPY) in the past 25 days has increased to 1.36%, much higher than 0.68% over the last 253 trading sessions. More volatility is expected to continue with investors unsure of what to expect in the next several months, as short term interest rates are due to move higher.
With the market breaking out of its 6 month range, short term risk has increased and it looks like the quiet low range days appear over. Our timing models remain unfavorable at this time.
What Do The Charts Say?
Ishares Russell 2000 ETF( IWM) Weekly Price (Top), and MACD (Bottom)
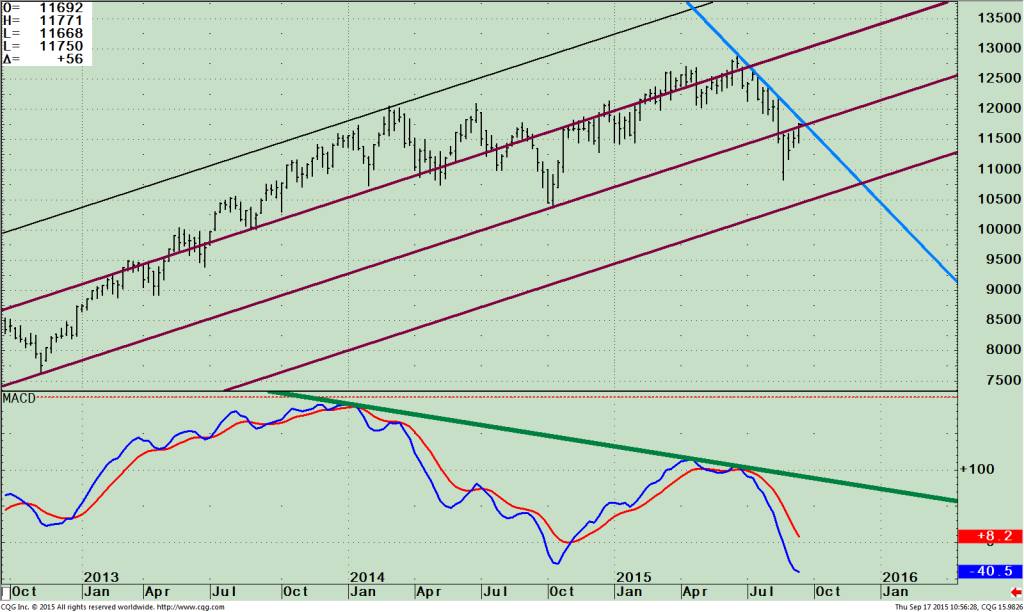
The top portion of the chart shows the weekly Ishares Russell 2000 ETF (IWM) which is made of companies with a market capitalization of between $300 million and $2 billion. When small caps are not leading the market higher, it’s normally not a good sign for a sustainable broad rally.
IWM peaked on June 22 at 129.10 about a month earlier than the S&P 500 (SPY). The IWM broke its uptrend like other averages after falling below 115.00, not quite reaching its lower channel objective of 102.50 at the 08/24/15 lows.
It appears the decline has stopped for now. IWM has rallied from its lows and is just below an important weekly downtrend line (the blue line), in position to either break the down trend or stall now in this area If the IWM were to rise from here breaking through 120.00, there is a possibility another rally attempt to 130.00, near the old highs could occur. If the market was to stall, and turn down breaking 112.50 a decline to the lower channel is possible.
Next support is at 105.00. A break below would mean a more significant decline is ahead. The jury is out.
The lower portion of the chart is the technical indicator MACD, (a momentum indicator). As the market moved sideways and then lower, momentum weakened. The trend remains down from December 2013
(green line) not in any position to be broken to the upside. Now momentum has stopped accelerating to the downside, which is a good sign. Also MACD has reset, falling below 0, generating an oversold condition from where meaningful rallies occur. A turn up from here would be positive.
Just To Sum Up:
The first half of September is positive, but September historically is a weak month. Daily volatility has increased leading to more opportunities ahead.
News today that the Federal Open Market Committee has delayed the rate hike could calm investors for the short term but will be the topic of discussion the next few months.
Our models are unfavorable along with the intermediate and longer term trend of the market. The jury is
out if there will be a retest of the August 24 lows which will be a safer entry than now.
I am recommending watching the Russell 2000 (IWM), to see if it breaks through 120.00 for the clue if the market will stall now or make another attempt toward the old highs. If the market stalls and turns down breaking 112.50 a decline to the lower channel is possible at 105.00. A break below 105.00 would mean a more significant decline is ahead. It’s not too late to review your portfolio and reduce your exposure.
Continued caution is advised.
I would love to hear from you! Please feel free to share your thoughts, ask your questions or comments.
Please call me at 1-844-829-6229 or email at bgortler@signalert.com.
*******Article in Systems and Forecasts September 18, 2015
This is a hypothetical result and is not meant to represent the actual performance of any particular investment. Future results cannot be guaranteed.
Although the information is made with a sincere effort for accuracy, it is not guaranteed either in any form that the above information is a statement of fact, of opinion, or the result of following any of the recommendations made herein. Readers are encouraged to meet with their own advisors to consider the suitability of investments discussed above for their own particular situations and for determination of their own risk levels.


Create more wealth in your life
with these simple strategies.
As an added bonus you will also
receive BG’s Updates and Ezine

Discover how to quickly create more well-being in your life with these simple strategies.
As an added bonus you will also
receive BG’s Updates and Ezine

As an added bonus you will receive BG’s Updates and Ezine

All work listed on BonnieGortler.com is licensed under a Creative Commons Attribution - Noncommercial - No Derivative Works 3.0 Unported License.
