

5 Investing Strategies to Save Money and Grow Wealth
04/11/2024
A tidal wave hit the market in the last two weeks of August. Key support in the S&P 500 (SPY) was broken at 204.00, with the 6 month trading range breaking to the downside. The S&P 500 fell fast and sharp over 6 straight days of decline, losing more than 11%, to a low on 08/24/15 of 182.40 that was just above the downside objective of 182.00 mentioned in my 08/20/15 newsletter article. A sharp reflex rally followed the drop, and the S&P 500 (SPY) finished the month of August down 6.26%. Damage has been done to the long term trend. Risk has increased and the 6 year bull market could possibly be over. A bear market might have started. The S&P 500 and many major averages are in the process of testing the lows of 08/24/15 trying to form a bottom, after the poor month of August and a wild start to September.
It’s a little early to know if the market will hold near or above the recent low or whether it will experience an additional leg down. Even some of the best companies and many investors lose big money. In the past a decline of over 20% or more only happens about once every 3 and 1/2 years, so it is possible as this bull market began in 2009.
With the longer term trend broken a big question is: could this turn out to be a historically significant bear market? As of now I don’t believe so but the near term action will give more clues. I do think more time is needed for a safer entry in case the lows are taken out and another leg down begins.
Recap of Key Insights from 08/21/15 Newsletter:
What is Happening Now
Short term MACD’s on many major averages are now oversold. Momentum patterns are improving as the market is testing the lows, but with the longer term trends now negative, more time for base building is necessary.
Intermediate and longer term patterns in MACD in the Healthcare and Biotech sectors are rolling over, (losing momentum) and are vulnerable to a further sell-off. The health care sector ETF (XLV) has broken the uptrend from January 2013 with the recent market weakness. Investors have large profits in this sector and might want to lock in some of their profits on any rallies. I continue to feel this is not a safe time to enter into new positions in the health care sector, a safer entry lies ahead.
The Financial Sector SPDR (XLF) fell below 24.00, breaking the weekly uptrend since May of 2012 and is now acting as resistance.
Energy, one of the weakest areas of the stock market reversed sharply with oil (USO) rallying 24% in 3 days, a rare historical event. This has been followed by more selling, giving up 10% as of this writing. Materials (XLB), is also testing lows. Both areas are still risky for the longer term.
International equities remain weak, including emerging markets (EEM) also testing recent lows. Many of these charts have lower highs and lower lows, not the ideal picture of a bottom in place. Risk remains.
The trailing 52-week new lows on the New Stock Exchange peaked at 1336 on 08/24/15, indicating possible panic selling. With the reflex rally, new lows are down to 100, but it would be better if they fall below 50 and stay there. The trailing 52-week new highs are single digits. One day on the decline there were 0 new highs! Companies that are making profits have been hit hard in this market, falling 20-30 %
or more.
Semiconductors (SMH) have rallied to below their support at 50.00, now acting as resistance. Semiconductors are a good sector to watch to see if they develop strength and close above 51.00, above the resistance.
Utilities were strong, with investors moving their money into more defensive sectors for safety. I was looking for a short term pullback which they had, but they are not acting right. Momentum patterns continue to weaken, not a good sign. This needs to be watched. The monthly trendline from the 2009 lows has also broken to the downside, turning the long term trend down.
The bond market didn’t rally when the stock market was falling hard and fast. This could be a sign of potential trouble ahead for the bond market.
The S&P 500 (SPY) as well as Apple had death-cross sell signals, joining the Dow Jones Industrial Average (DJIA). (Death cross refers to the situation when price falls below a 50-day simple moving average, and crosses below a 200-day moving average.) On 09/02/15, the Russell 2000 (IWM) also generated a death cross signal.
Small caps (ETF:IWM) are not leading the advance when the market rises intraday. Watch how the small caps react on rally attempts. If the small caps lag, this would not be a healthy sign for the advance to continue.
Volume patterns on the New York Stock Exchange and the Nasdaq did get oversold as the market fell. Monitor what happens on up days. If volume is increasing, that would be favorable. If the volume is less, investors are selling the rally and most likely further gains would be contained.
Volatility (VIX, a measure of fear) spiked to over 53.29. This is a very high reading: earlier in the year we were below 15. The VIX pulled back to 24.49 on the reflex rally and is now trading at 23.45.
Intraday volatility is to be expected during the next few months. The quiet days that we had early in the year are gone. Daily swings of 2-3% could occur much more regularly.
What Do The Charts Say?
SPDR S&P 500 (SPY) Weekly ETF (Top) and MACD (Bottom)
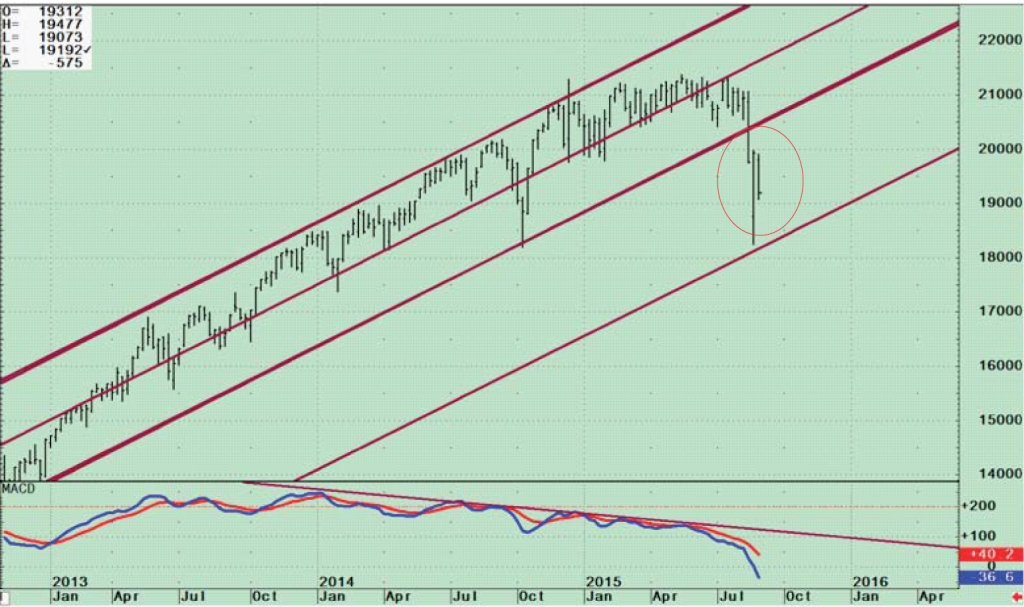 The top portion of the chart shows the S&P 500 (SPY) falling sharply and quickly penetrating support at 204.00, declining to its downside objective (lower channel) of 182.00 discussed in the previous newsletter.
The uptrend from January 2013 clearly has been broken to the downside, changing the intermediate trend from positive to negative. Major resistance if the market moves higher than I expect is 207.00, the area where the S&P 500 broke down from.
After a big decline like we have had, it’s normal for a re-test of the lows to take place within 3-6 weeks, a much safer entry. If the lows are violated now a more serious decline is likely to occur. Downside objectives are 1700, followed by 1600.
The lower portion of the above chart is the technical indicator MACD, (a momentum indicator) clearly showing continued declining momentum as the market moved lower. MACD is falling, now below 0, oversold and where meaningful rallies develop. No turn up in MACD has taken place, so any buying now would be considered bottom fishing and could be dangerous.
SPDR S&P 500 (SPY) Monthly ETF (Top), and MACD (Bottom)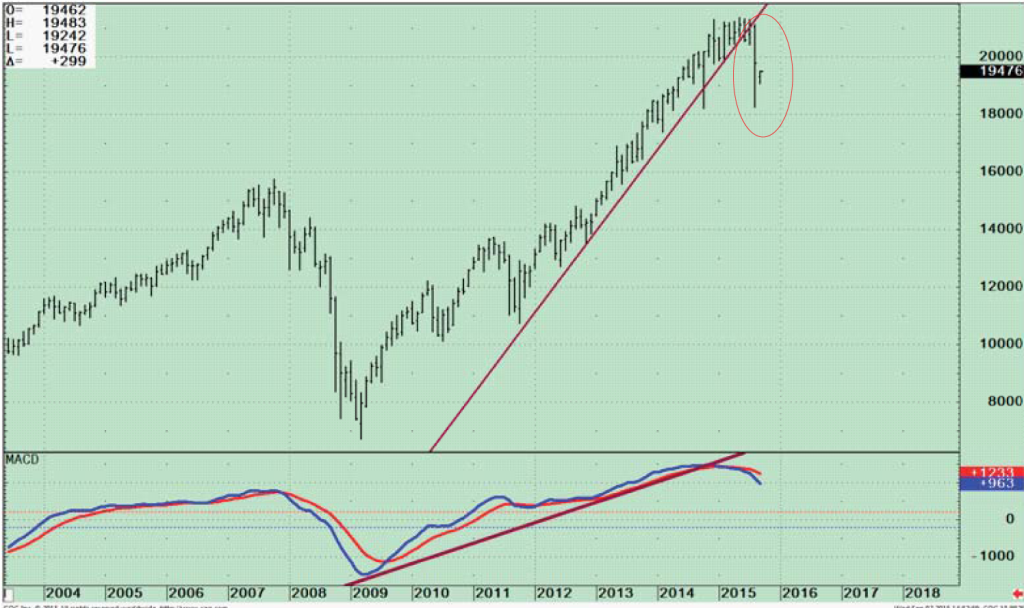 The top part of the chart at right is the S&P 500 (SPY) clearly breaking the monthly uptrend that was intact since 2011. The S&P 500 is now confirming the earlier MACD sell (lower part of the chart), joining other sectors of the market. With the trend unfavorable for the longer term, it will be harder to make money from the long side and it is possible more downside will occur. Time will tell.
Just To Sum Up.
The month of September is historically a weak month.
The S&P 500 and many major averages are in the process of testing the lows of 08/24/15 trying to form a bottom after the poor month of August. The S&P 500 (SPY) has shifted from positive to negative for the intermediate and long term trend.
As of 09/02/15 the market in general has stopped falling and is trying to form a short-term bottom and move higher. With the intermediate and longer term trend unfavorable, I am expecting the market to need more time to build a base and form a safer bottom that can sustain an upwards trend for more than a few hours, days or weeks. Momentum indicators are not signaling a safe entry now. Many other sectors are also in downtrends, and our models are not favorable. The market is not out of the woods yet and is likely to test the 08/24/15 lows in 3-6 weeks. If the low in the S&P 500 (SPY) is violated (182.40) expect another leg down to take place that could accelerate much lower, 170 followed by 160.00.
It’s not too late to evaluate your portfolio and reduce your exposure if you haven’t already, until the intermediate and long term momentum patterns are more favorable. Caution is advised.
I would love to hear from you! Any thoughts, questions comments, feedback. Please call me at 1-844-8296229 or email at bgortler@signalert.com.
*******Article in Systems and Forecasts September 4, 2015
This is a hypothetical result and is not meant to represent the actual performance of any particular investment. Future results cannot be guaranteed.
Although the information is made with a sincere effort for accuracy, it is not guaranteed either in any form that the above information is a statement of fact, of opinion, or the result of following any of the recommendations made herein. Readers are encouraged to meet with their own advisors to consider the suitability of investments discussed above for their own particular situations and for determination of their own risk levels.


Create more wealth in your life
with these simple strategies.
As an added bonus you will also
receive BG’s Updates and Ezine

Discover how to quickly create more well-being in your life with these simple strategies.
As an added bonus you will also
receive BG’s Updates and Ezine

As an added bonus you will receive BG’s Updates and Ezine

All work listed on BonnieGortler.com is licensed under a Creative Commons Attribution - Noncommercial - No Derivative Works 3.0 Unported License.
